


A strategy-level autopsy: the WLFI five-hour pre-signal, the Hyperunit on-chain trade, ETH/BTC carry trade mechanics, funding rate arbitrage, ADL force-settlement, and the 37-point performance spread that separated funds that collected from funds that bled
Approximately $19 billion in forced liquidations. $36.71 billion in open interest destroyed. For the crowd, October 10, 2025 was the worst deleveraging event in crypto history. For a specific class of trader — one who understood the plumbing before the pipes burst — it was a transfer mechanism operating exactly as designed. This is the anatomy of that transfer: who was positioned, how each strategy paid, and what the verified performance data confirms.
Based on primary data from Amberdata, CoinDesk, InvestmentNews, 1Token, Cointelegraph, Blockonomi & on-chain forensics · Analysis current through February 2026
01 · The Numbers: The Crash in Microstructure
On the afternoon of October 10, Trump posted an initial Truth Social threat of “massive” tariffs on Chinese goods — rattling equity markets but not yet triggering crypto’s cascade. Then, at precisely 20:50 UTC, the specific 100% tariff announcement landed. Crypto markets — operating 24/7 without circuit breakers — absorbed the full shock while traditional markets were closed for the weekend and institutional market makers had stepped back. Confirmed by NBC News and CNN, Trump announced the tariff would take effect November 1 or sooner. What followed was the largest deleveraging event in crypto history.
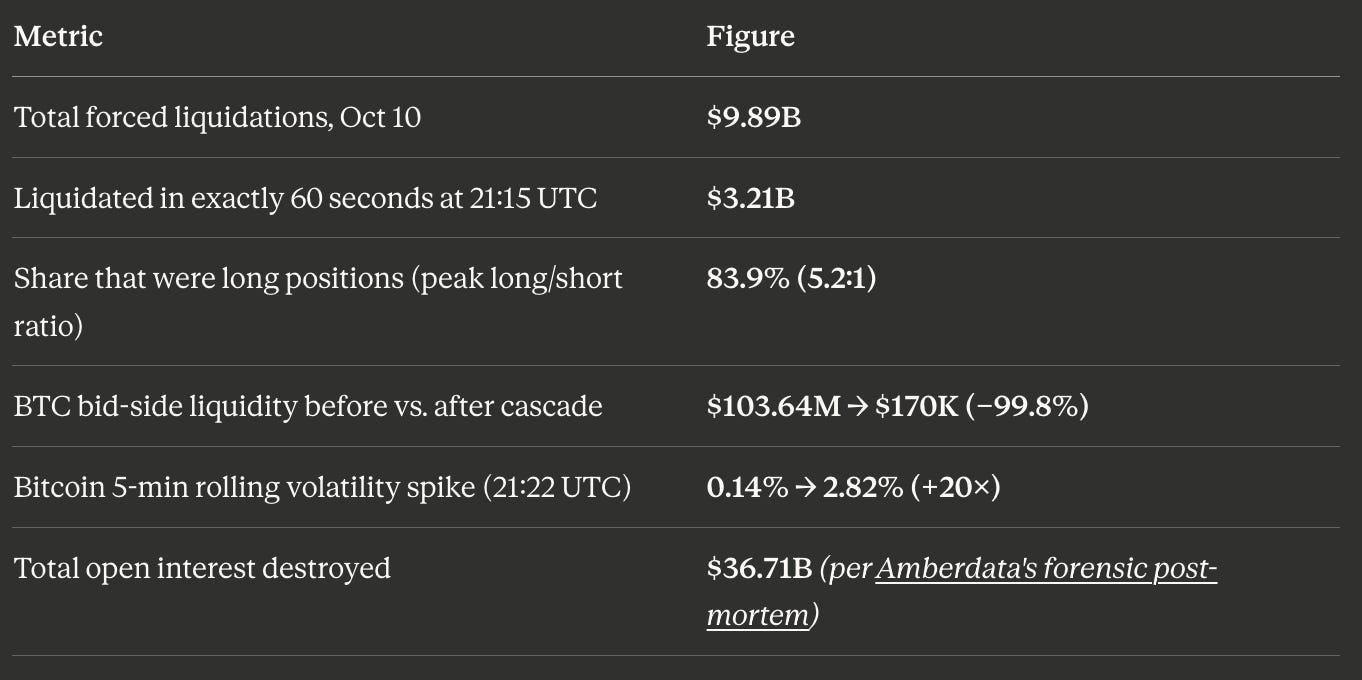
Amberdata’s forensic post-mortem reconstructed the event across seven market microstructure dimensions. Within a 40-minute window, $6.93 billion in positions were forcibly liquidated at a rate of $10.39 billion per hour — 86 times the pre-cascade pace. Bid-ask imbalance flipped from +0.0566 (buyer-heavy) to −0.2196, sellers overwhelming at a 78:22 ratio. Bitcoin fell 6.84%; altcoins collapsed 20–27%.
Note on scope: The $9.89B figure is Amberdata’s forensic post-mortem count for its tracked exchange universe during the specific cascade window. Amberdata’s own year dashboard, Investing.com, and CCN cite the all-crypto, full-event figure as approximately $19 billion — reflecting broader exchange coverage and the extended 24-hour window. Both figures are real; they measure different scopes.
The FT’s Menke and Carver diagnosed the leverage architecture precisely: volatility collateralizing volatility, cross-margined accounts, rehypothecated collateral, code-embedded leverage all compounding each other. What they did not write is who was on the other side.
02 · The Pre-Signal: WLFI Gave a Five-Hour Warning
One of the most significant and least-covered findings to emerge post-crash: Amberdata’s research documented that World Liberty Financial Token (WLFI) — a governance token linked to the Trump family’s DeFi platform — began declining sharply more than five hours before Bitcoin reacted. BTC was near $121,000 with no visible distress. WLFI was already in freefall.
Amberdata identified three simultaneous anomalies:
Hourly WLFI trading volume spiked to approximately $474 million — 21.7× its typical baseline within minutes of tariff-related headlines appearing
Perpetual futures funding rates climbed to 2.87% per 8 hours (~131% annualized), signaling extreme leveraged directional positioning
WLFI’s realized volatility reached nearly 8× that of Bitcoin during the same window
Mechanism — Collateral Cascade: When WLFI fell, margin buffers for traders who had used it as collateral shrank, triggering forced sales of liquid assets like BTC and ETH, pushing prices lower, triggering more liquidations. Amberdata confirmed the cascade was already in motion before most participants could see it in BTC or ETH price action.
Amberdata’s Head of Research Mike Marshall concluded that the “five-hour lead time separated a potential warning from statistical noise” and called the activity “instrument-specific.” Critically, Amberdata also cautioned against overinterpreting a single event as statistical proof — the informational advantage from such a signal diminishes as more traders monitor similar patterns. The lesson is structural: monitoring highly leveraged tokens with concentrated ownership and extreme funding rates can surface stress in derivatives markets before it reaches majors.
03 · The $200M Trade: The Hyperunit Whale Execution Sequence
The most documented single trade of the crash has been compressed into a profit headline without the execution sequence that makes it analytically useful.
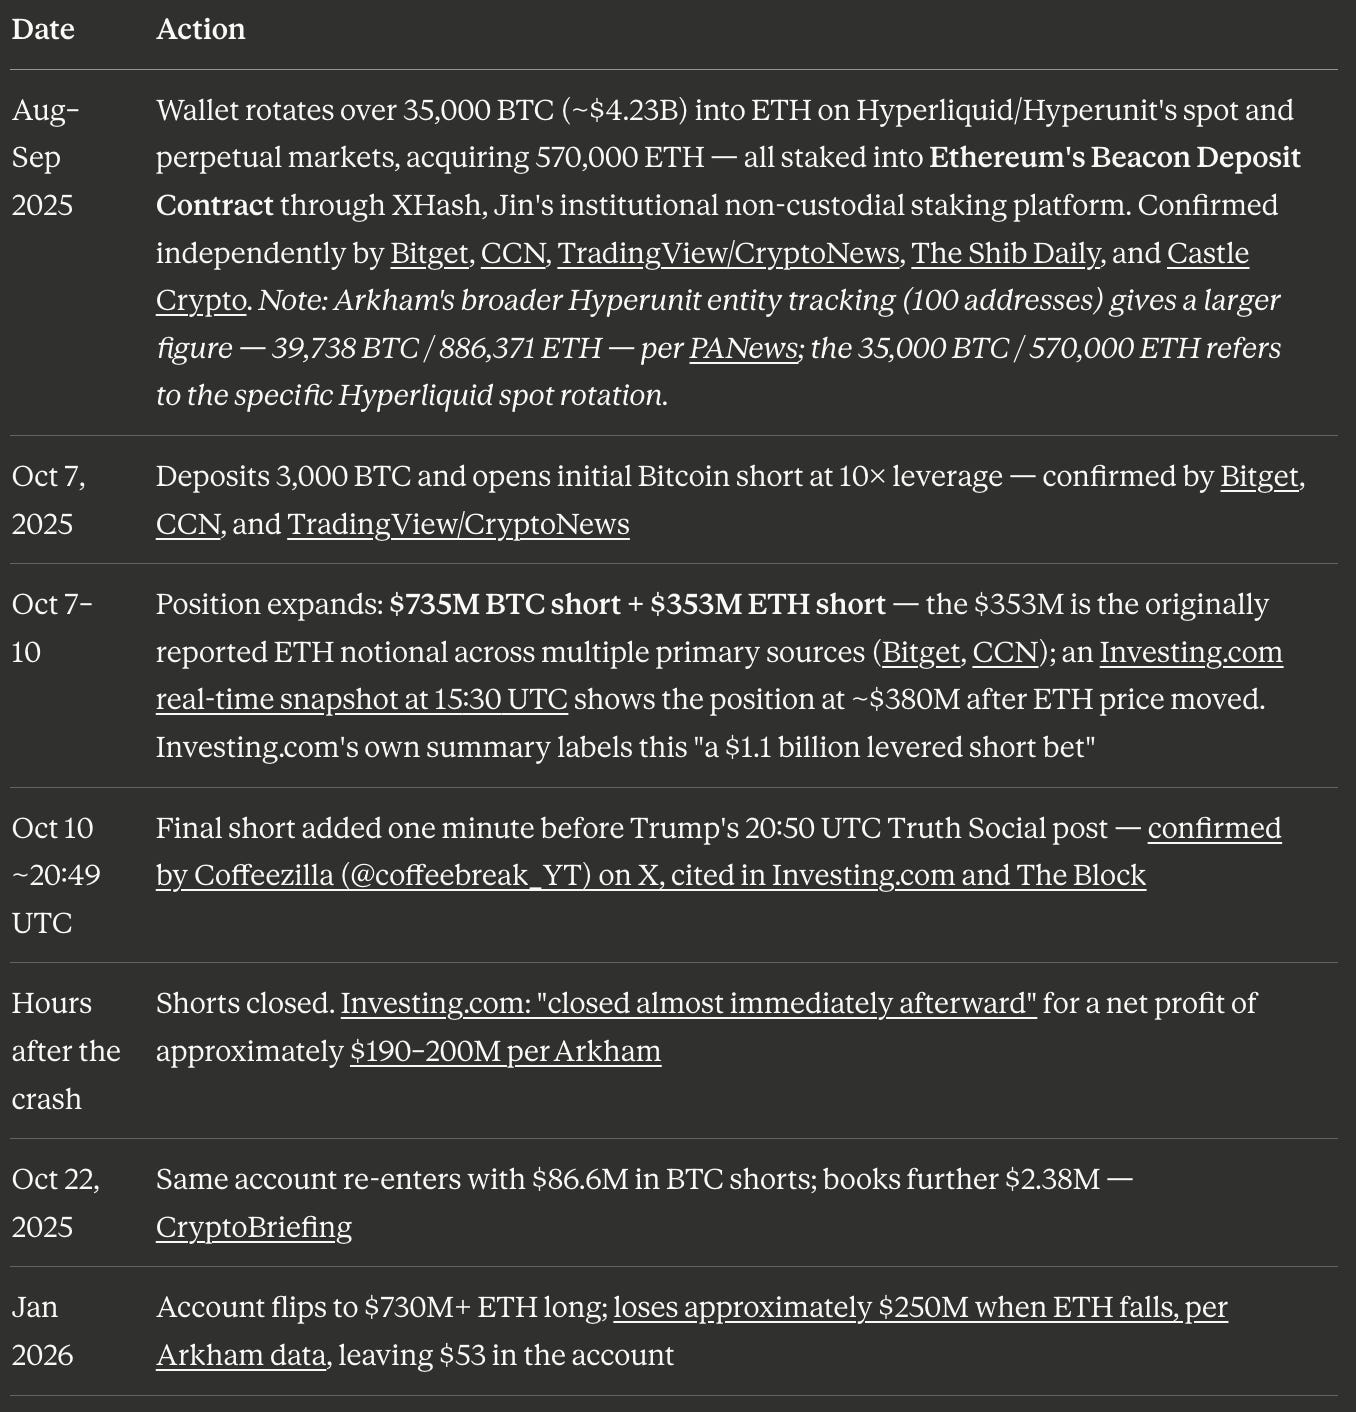
Bitget, CCN, TradingView/CryptoNews, The Shib Daily, and Castle Crypto. PANews
Bitget, CCN, and TradingView/CryptoNews
(Bitget, CCN); an Investing.com real-time snapshot at 15:30 UTC
confirmed by Coffeezilla (@coffeebreak_YT) on X, cited in Investing.com and The Block
Investing.com: “closed almost immediately afterward” , $190–200M per Arkham
On-chain investigator Eye (@eyeonchains) publicly alleged the trade was linked to Garrett Jin, former CEO of the collapsed BitForex exchange, tracing two ENS domains: ereignis.eth (“event” in German) and garrettjin.eth — the latter pointing directly to Jin’s verified X account @GarrettBullish. The Shib Daily reports Jin holds 46,295 BTC across eight separate wallets, with the 35,000 BTC rotation and staking activities tracing to BitForex-related addresses and exchanges including Huobi (HTX) and Binance — confirmed by Cointelegraph and The Block. Jin denied ownership in a public X post on October 13, 2025, his verbatim statement — sourced by The Shib Daily and The Block — was: “The fund isn’t mine — it’s my clients’. We run nodes and provide in-house insights for them.” Analyst Quinten François noted the ENS link “sounds way too simple to be true.” The identity question remains alleged, not legally established.
What is not in dispute: the trade was executed on Hyperliquid’s fully transparent on-chain order book, and the profit was real. The January 2026 ETH loss underlines the critical distinction this article builds toward — directional bets reverse. Structural strategies do not.
04 · The Carry Trade: October’s Positive ETP Flows — and What the Unwind Confirms
The Hyperunit whale required exceptional timing and directional conviction. The funds that structurally outperformed required neither. While the whale was building its short in the days before October 10, a different class of institution had already been positioned for months — not betting on a crash, but collecting yield mechanically from the overcrowded long side of the perpetual futures market. The crash did not make their trade. It accelerated a profit that was accumulating every eight hours regardless of price direction.
By July 14, 2025, CoinDesk reported that hedge funds had built a record $1.73 billion net short position in ETH CME contracts — largest on record per CFTC data. Thomas Erdösi, head of product at CF Benchmarks (whose reference rates underlie all CME crypto derivatives), stated: “There is evidence suggesting that a notable portion of the short interest in Ether futures is tied to the carry trade. U.S. ETH ETF inflows have remained steady over the past three months, coinciding with an increase in futures short interest — potentially signaling an uptick in basis trades.”
How the ETH Basis Trade Works:
Structure: Short ETH CME futures + buy spot ETH ETFs + stake physical ETH.
At July 2025 conditions:
9.5% basis yield+3.5% staking yield= approximately 13% annual return with zero net directional price exposure.When October hit and ETH fell ~20%: CME short legs gained in value. The basis trade required no crash prediction — only hedge maintenance. Profit locked in as the spread converged.
Funds entering the ETH CME basis trade from November/December 2024, when the ETH CME basis was around 20%, were sitting on highly profitable short legs the moment the crash occurred. The BTC front-month annualized basis ran near 10% through September 30, 2025, with leveraged funds consistently net short CME futures as ETF inflows grew.
The definitive evidence: CryptoSlate reports October’s net all-crypto ETP inflows reached $7.6 billion despite the crash — the direction of flow is what matters here, not just the number. And the Amberdata year dashboard, cited throughout this article, shows BTC spot ETF flows remained positive for the month. That is not retail buying the dip. The carry trade story goes one step further: Amberdata’s own head of research Michael Marshall, writing in a December 4 CoinDesk analysis, confirmed that the subsequent Nov–Dec ETF outflows were driven by basis trade unwinds — funds closing their ETF spot legs as the annualized basis compressed from 6.63% to 4.46%, falling below the ~5% breakeven threshold. This is the complete arc: carry trade funds opened positions before the crash, profited mechanically as futures shorts appreciated, then closed positions rationally as the spread narrowed. Every phase of that arc — entry, crash profit, exit — was structural, not directional.
05 · Named Executives: Who Made Money and What They Said
InvestmentNews’s December 19, 2025 investigation gathered the most granular on-record account of crash-day performance from fund executives.
Bohumil Vosalik, CEO, 319 Capital (BVI): “Those who were ready — with collateral well allocated across exchanges and systems in place — were able to generate 1% to 3% of gross returns in less than an hour.” His fund posted a 1.5% gain in October and 0.4% in November, for a year-to-date net return of 12.2%. Source: pre-positioned collateral across multiple exchanges, operational when others encountered connectivity failures and order-routing breakdowns.
Peter Kosa, head of growth, Sigil Fund: Sigil’s directional Core fund ended down 6.73% for 2025. Its market-neutral ‘Stable’ fund finished up 11.26%.
Paul Howard, director, Wincent (market maker): “Investors are using structured products with downside protection, which reduces volatility and increases alpha decay.” Institutional ETF entry has tightened spreads and eliminated “dependable double-digit monthly returns” that earlier carry trade operators extracted.
Full-year strategy performance (Crypto Insights Group via InvestmentNews):
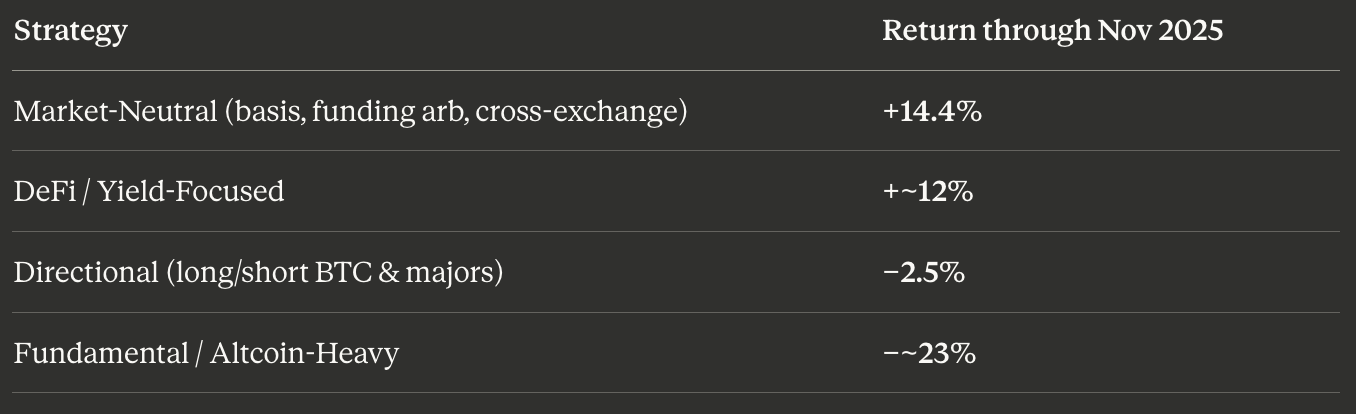
The 37-point spread between market-neutral and altcoin-heavy strategies is not statistical noise. It is the quantitative proof of a structural thesis.
06 · The Mechanism: Funding Rate Arbitrage — Structural Yield Without Price Prediction
A perpetual futures contract has no expiry. To keep its price anchored to spot, exchanges use a funding rate — a payment every 8 hours between longs and shorts. When markets are crowded long, longs pay shorts. A fund running funding rate arbitrage buys spot BTC and simultaneously shorts equivalent notional in BTC-USDT perpetuals. Price risk nets to zero. What remains is the funding payment collected from the overcrowded long side every 8 hours.
At 0.03% per 8-hour interval (CoinGlass execution example) with $4,000 in matched notional, the annualized yield is approximately 32.95%. During extreme conditions, funding rates on trending tokens can briefly exceed 0.10% per 8 hours — over 100% annualized for arb funds positioned to receive.
Academic validation: A peer-reviewed study published August 2025 in ScienceDirect, examining funding rate arbitrage across Binance, Bitmex, ApolloX, and Drift, found the strategy generated up to 115.9% returns over six months with maximum losses limited to 1.92% and zero correlation with a HODL approach.
Real-world NAV evidence comes from 1Token’s Quant Strategy Index VII (October 2025), built from real trading data contributed by 9 crypto quantitative trading teams managing over $4 billion combined AUM, running live on Binance, OKX, and Bybit, measured by Time-Weighted Return. Eight of the nine contributed funding arbitrage strategies. The November follow-up expanded to 11 teams, still at $4B+.
Cross-exchange amplification: Amberdata’s crash analysis flagged “funding rate divergence proving market fragmentation” as one of its seven key dimensions — exchanges showed materially different funding rates in real time during the cascade. A fund with collateral pre-deployed on both Binance and OKX could short Binance perps while going long OKX perps, netting the spread with zero net directional exposure. Vosalik’s 1–3% in less than an hour came precisely from this: collateral already in place on multiple exchanges when the divergence peaked.
07 · The Force Multiplier: Auto-Deleveraging as a Free Exit
When exchange insurance funds are exhausted by forced liquidation losses — as they were on October 10 — exchanges execute Auto-Deleveraging (ADL): they identify the traders with the most profitable opposing positions and force-close those positions at the current market price to cover losses the exchange cannot otherwise absorb.
For a fund correctly positioned short before the cascade, ADL is a forced exit at or near the optimal price. The exchange’s emergency settlement mechanism crystallizes gains automatically — no human order required. Position size matters: the larger the profitable short, the higher the ADL priority ranking. Coin Edition’s December 20 analysis identified the October 10 ADL event as causing “$2 billion in a single move” that damaged directional managers. That $2 billion went somewhere.
08 · The Sequel: Thin Order Books as a Volatility Farm Through November
CoinDesk Research confirmed on November 15 that order-book depth across major exchanges remained structurally impaired through November — market makers had retreated and not returned. SOL, XRP, ATOM, and ENS saw 1%-level depth fall from roughly $2.5 million to $1.3 million and hold there. CoinDesk stated explicitly: this environment was “ideal for those operating an options straddle.”
An options straddle — simultaneously buying a call and a put at the same strike and expiry — profits from any large move in either direction. Bitcoin had peaked at approximately $125,000–$126,000 on October 6 (CBS News, EBC Financial). After recovering partially from the Oct 10 crash, it traded near $99,700–$100,000 in mid-November before sliding to approximately $80,500–$82,000 by late November — EBC Financial data: “from roughly 99,700 USD on 14 November to about 82,000 USD on 21 November.” Fortune’s flash crash analysis confirms the $80,500 low. Multiple violent intraweek reversals across this range paid long-volatility straddle positions established in the post-crash low-vol window. Amberdata’s Leverage Purge analysis documented three distinct liquidation phases totaling $8.55 billion through late November, with daily liquidations at peak reaching 2.1% of total open interest — each phase generating fresh opportunities for vol-long or pre-positioned short infrastructure.
09 · The Thesis: Three Things That Separated Collectors from Casualties
Every transfer has two sides. On the other side of every long liquidation is a short being made whole. On the other side of every elevated funding rate paid by a crowded long is the short perp leg collecting every 8 hours. On the other side of every ADL event is a profitable short book force-settled at the best available price. On the other side of every thin order book is a long-volatility straddle collecting from swings in both directions.
Three factors separated the funds that collected from those that lost:
1. Understanding the cross-margining leverage stack. The FT’s Menke and Carver documented how a single BTC deposit could carry 5.5× effective leverage through layered cross-margining, rehypothecated collateral, and embedded perpetual positions — a structure invisible to most participants until it liquidated. Knowing that architecture means knowing exactly where cascade triggers sit and how far the chain reaction travels before exhausting itself.
2. Recognizing the structural fragility of Friday-evening macro shocks. No circuit breakers, no market makers, batch-mode risk systems, humans who need sleep. Amberdata confirmed this was “nanosecond execution speed with frontier-era risk management.”
3. Structural yield collection — the most durable edge. Every bull market creates an overcrowded long side in perpetual futures, which mechanically generates positive funding rates. Collecting those rates delta-neutrally requires no directional view — it paid during the setup, during the cascade, and through November as directional funds continued to bleed.
“Market-neutral strategies remained the most common approach, favored for their ability to manage risk while seeking returns.” — PwC / AIMA 6th Annual Global Crypto Hedge Fund Report, written before October 2025 produced a 37-point performance spread
The playbook is narrowing. Wall Street’s entry compresses spreads. But as long as retail and CTA capital flows into perpetual futures and creates overcrowded longs, the structural yield persists. October 2025 did not create that yield — it made its existence undeniable. The crash was not anomalous. It was the leverage architecture operating exactly as designed, transferring capital from those who misunderstood the plumbing to those who had mapped it in advance.
📊 Want Deeper Quantitative Analysis?
This research took significant time in data collection, multi-round verification against primary sources, and institutional-grade analysis. If you found value in this deep-dive, I publish exclusive quantitative research, trading strategies, and institutional-grade analysis on Patreon.
By joining, you will be supporting independent research and motivating more content like this.
→ Join the Patreon community here
Primary Sources
Crash Microstructure & Liquidation Data
Amberdata — How $3.21B Vanished in 60 Seconds: October 2025 Crypto Crash
Amberdata — The Leverage Purge: How $8.55B in Liquidations Reset the Market
CryptoSlate — How $150 Billion Was Liquidated From Crypto Markets in 2025
Fortune — What Happened in the Crypto Flash Crash: Wall Street’s Stress Test
WLFI Pre-Signal
Amberdata — The Volatility Framework: How to Read Crypto’s Stress Signals
Coindoo — $6.93B Crypto Liquidation Event Preceded by WLFI Selloff
The Coin Republic — WLFI Crash Foreshadowed $6.9B Liquidation
Hyperunit Whale / Garrett Jin
Cointelegraph — Investigation Ties 100K BTC Hyperliquid Whale to Former BitForex CEO
Investing.com — The Crypto Crash and the Mystery of the $1 Billion Whale
The Shib Daily — Ex-BitForex CEO Denies Ties to 100K BTC Whale in Fraud Scandal
CCN — How On-Chain Data Linked a $11B Hyperliquid Whale to BitForex Former CEO
Castle Crypto — Inside the Garrett Jin Mystery: The Billion-Dollar Crypto Whale
CryptoBriefing — Hyperunit Whale Closes $86.6M Bitcoin Shorts for $2.38M Profit
The Block — Infamous Hyperunit Whale Exits Entire ETH Position for $250M Loss, $53 Left
Basis Trade & ETF Flows
CoinDesk — Ether Sees Record Short Build-Up as Hedge Funds Pile on Basis Trade
Blockonomi — Massive Ethereum Shorts Are a Feature, Not a Flaw: The Basis Trade Explained
FXStreet — Ethereum Annual Price Forecast: ETH Poised for Growth in 2026
CF Benchmarks — Revisiting the Bitcoin Basis: Structural Drivers of Basis Activity (Sep 2025)
CryptoSlate — Bitcoin ETF Record Outflows Are Deceptive: Crypto Products Absorbed $46.7B in 2025
Fund Performance & Named Executives
InvestmentNews — Crypto Chaos Jolts Hedge Funds in Worst Year Since 2022 Crash
Coin Edition — Why Crypto Hedge Funds Are Losing Money in 2025
Funding Rate Arbitrage Mechanics
Post-Crash Liquidity & Volatility
CoinDesk — Crypto Liquidity Still Hollow After October Crash, Risking Sharp Price Swings
EBC Financial — Why Is Bitcoin Falling? Real Reasons Behind the BTC Drop
This article is for informational purposes only and does not constitute investment advice.
Connect with Navnoor Bawa
📺 YouTube — The Mathematical Trader · Quantitative analysis, strategy breakdowns, and market deep-dives
💼 LinkedIn — Navnoor Bawa · Institutional research and professional commentary
🎯 Patreon — Exclusive Research & Strategies · In-depth quantitative work not published anywhere else
Cover photograph: Marko Ahtisaari, CC BY 2.0, via Wikimedia Commons.
Cover photograph: Marko Ahtisaari, CC BY 2.0, via Wikimedia Commons.
Absolutely insane level of research rigor. I wouldnt be surprised if you are juggling multiple offers from hedge funds pretty soon