


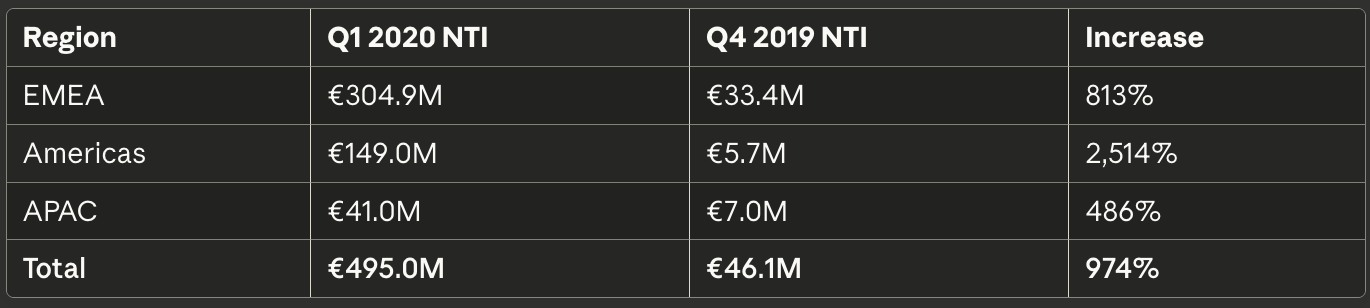
Flow Traders posted €495M net trading income in Q1 2020 — a 974% quarterly increase and 3,543% profit surge to €262.3M. The firm maintained continuous two-sided markets across 13,000+ ETP listings while VIX hit 82.69 and bond ETFs traded at -6% NAV discounts, capturing systematically wider spreads during March 2020’s liquidity crisis.

Market Dislocation Mechanics
Volatility Regime Shift
VIX closed at 82.69 on March 16, 2020 — the highest level since 1990 inception, exceeding November 2008’s 80.86 peak. Intraday VIX touched 85.47 on March 18.[¹] Market ETP value traded increased 100% Q/Q and 80% Y/Y. Flow Traders’ ETP value traded: €441.6B (+76% Q/Q).[²]
Bond ETF Basis Blowout
Investment-grade ETF discounts to NAV on March 12, 2020 (per Morningstar’s March 20, 2020 analysis; similar magnitudes documented by IOSCO and FSB):[³]
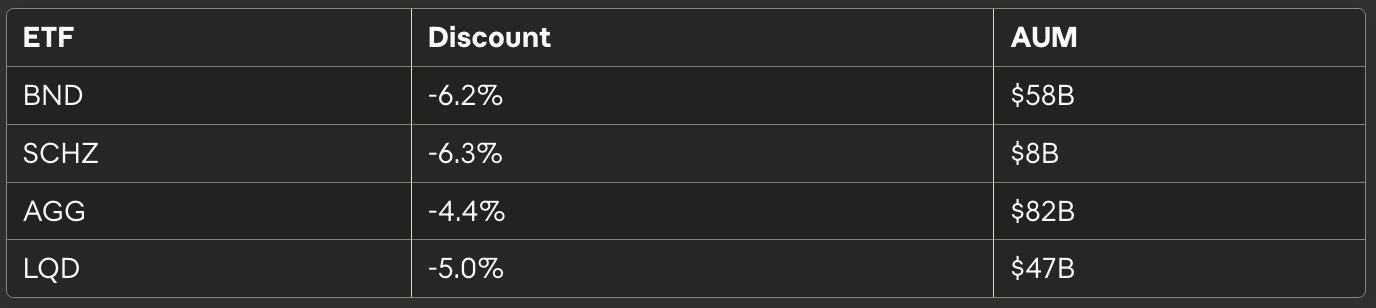
LQD’s underlying bond market: 40% of constituents traded 1–5x daily while the ETF itself traded thousands of times daily.[⁴] LQD declined 25% from peak — fastest drawdown on record — as constituent bond spreads widened 3–5x.
Trade Execution
Core Strategy
Flow Traders maintained delta-neutral market making through:
Spread capture: Posted continuous bid-ask quotes while underlying spreads widened 3–5x
Dynamic hedging: S&P 500 futures, Treasury futures, CDS for basket risk
Creation/redemption arbitrage: Executed when spreads justified transaction costs
Inventory turnover: Created/redeemed at PNU thresholds with €771M trading capital
Operational Infrastructure
Business continuity: Tents in Amsterdam office enabled 24/7 operations with split teams and backup locations (NY, HK). Substantially increased trading activity with no outages or downtime.[⁵]
P&L Attribution
Regional Performance (Q/Q vs. Q4 2019)
Profit Drivers
Volume expansion: ETF trading reached 40% of total U.S. equity dollar volume vs. 25–30% baseline.[⁶] Daily volumes 5–10x normal.
Spread widening: Investment-grade ETF spreads expanded from 1–2 bps to 20–50 bps intraday. Components:
Execution risk on basket transactions
Credit risk premia (BBB spreads: 1.3% → 4.9%)
Hedging costs in illiquid credit
Inventory carrying costs
Premium/discount arbitrage: LQD at -5% discount = buy ETF at $95, basket at $100. Profitable only with hedging capacity. Flow Traders’ advantage: €771M trading capital, €273M excess regulatory capital, real-time risk systems.
Operating Leverage
EBITDA: €323.7M (65% margin) vs. €11.7M (25%) in Q4 2019
Operating expenses: €171.2M (≈35% of NTI); employee expenses €154.9M (≈31% of NTI)
Fixed employee expenses: €11.8M (2.4% of NTI)
Total operating expenses in Q4 2019: €34.4M (75% of NTI)
EPS: €5.71 vs. €0.16 in Q4 2019
Competitive Advantages
Infrastructure Moat
Technology: No outages despite substantially increased trading activity. Continuous pricing across 13,000+ listings with real-time risk.
Balance sheet: €771M trading capital enabled inventory warehousing when credit premia spiked. Many arbitrageurs lacked capital to hold positions.
Operations: Split teams and backup locations ensured uninterrupted presence. 80% staff remote within days.
Market Microstructure Edge
ETFs substituted for dysfunctional OTC bond markets — continuous electronic pricing beat phone-based dealer quotes. On March 12, LQD traded 90,000x while top 5 holdings traded 37x average.[⁷]
Key insight: ETFs became price discovery vehicles for credit markets unable to transact at scale.
Quantitative Analysis
Nonlinear Volatility Returns
Flow Traders’ 974% NTI increase exceeded 100% market ETP volume increase by 874 bps. Relationship between volatility and market maker returns is convex — each VIX point above 30 produces disproportionate profit.
Historical comparison: Q1 2020 was an 11-sigma event relative to prior 24 quarters per Alphacution’s statistical analysis.[⁸]
Market Microstructure Requirements
ETF arbitrage capital requirements:
Prime broker credit lines
Real-time risk systems
Balance sheet for inventory warehousing
Operational continuity in stressed markets
Firms lacking these capabilities couldn’t capture spreads despite visible opportunities.
“Only Bid” Premium
In fragmented markets where underlying assets trade discontinuously, ETFs with committed market makers become primary liquidity. Flow Traders’ 65% EBITDA margin reflected this structural premium.
Performance Sustainability
Mean Reversion Analysis
Q1 2020 represents extreme outlier. Normalized performance:
Q1 2025 results:[⁹]
NTI: €140.2M (third consecutive triple-digit quarter)
Net profit: €36.3M (-21% Y/Y)
EPS: €0.84
EBITDA margin: 46%
Structural improvements:
Diversification across asset classes (equity, fixed income, digital assets)
Regional expansion (APAC growth)
Reduced single-factor dependency
Baseline performance requires sustained VIX 20–30, not 80+.
Implications for Market Makers
Three Core Lessons
1. Infrastructure investment converts to alpha in crises
Years of technology and risk system development enabled processing substantially increased trading activity with no downtime. Capital expenditure on infrastructure yields asymmetric returns during stress events.
2. Balance sheet capacity is fundamental alpha
€771M trading capital with €273M excess regulatory capital separated Flow Traders from undercapitalized competitors. Market making profitability during volatility spikes depends on warehousing ability.
3. Operational resilience creates monopoly rents
Business continuity execution — tents, split teams, backup locations — ensured uninterrupted presence. The operational premium during crises exceeds typical spread compression in normal markets.
Conclusion
Flow Traders’ €495M Q1 2020 NTI demonstrates how market structure advantages converge during liquidity events. The firm captured wider spreads by maintaining continuous markets when capital was scarce. Operational resilience, balance sheet capacity, and technological infrastructure form a sustainable moat in electronic market making.
The trade wasn’t predictive — it was infrastructural. In fragmented markets during stress, being the only continuous bid extracts monopoly rents.
Sources
[¹]: “VIX All-Time Highs and Biggest Spikes,” Macroption (2025). VIX closing data from CBOE official records.
[²]: Flow Traders Q1 2020 Trading Update, GlobeNewswire (April 21, 2020). Official company disclosure.
[³]: “Navigating ETF Discounts and Premiums During Turbulent Times,” Morningstar (March 20, 2020). ETF premium/discount data for March 12, 2020.
[⁴]: “Exchange traded funds in volatile markets,” ICE Data Services (2020). Analysis of LQD constituent bond trading frequency vs. ETF trading volume.
[⁵]: “Flow Traders,” Wikipedia (accessed November 2025); “Campout For Profits: Why Tents In The Office Earned Flow Traders Massive Pandemic Returns,” Benzinga (March 19, 2024).
[⁶]: “ETFs Are Passing the COVID-19 Crisis Test,” Investment Company Institute (March 2020). ETF trading as percentage of total U.S. equity dollar volume.
[⁷]: BlackRock Q1 2020 earnings call commentary on LQD trading frequency vs. underlying bonds (April 2020).
[⁸]: “Alphacution: Flow Traders Q1 at $545.7mn, an 11-sigma print on prior quarters,” Finadium (February 16, 2021). Alphacution’s statistical analysis of Flow Traders quarterly performance distribution across 25 quarters beginning Q1 2014.
[⁹]: Flow Traders Q1 2025 Trading Update and earnings call transcript, Investing.com (April 24, 2025).
Methodology Note: All financial data verified against official Flow Traders disclosures (Euronext: FLOW). VIX data from CBOE. ETF premium/discount data from Morningstar and ICE. Bond trading data from BlackRock and BIS reports. Regional NTI breakdown and operating metrics from company quarterly reports.
Cover photograph: Rokus Cornelis, CC BY 3.0, via Wikimedia Commons.