


The commodity trading industry generated $150 billion in gross margin in 2022 and $100 billion in 2023—$250 billion across two years, representing the highest back-to-back performance on record. While headlines focused on Russia-Ukraine disruption and energy volatility, the systematic alpha came from three sources: physical infrastructure control, regulatory arbitrage, and forensic execution across fragmented supply chains.
Elite firms like Citadel ($8B in 2022), Vitol ($15.1B in 2022), and Glencore ($6.4B in 2022) didn’t merely trade volatility—they owned the storage tanks, pipelines, and warehouses that converted market dislocations into structural edge. This analysis reverse-engineers verified trades, regulatory filings, and investor letters to document exactly where capital was deployed and how the profits materialized.
Energy: Physical Infrastructure as Trading Alpha
Citadel: $8B (2022) + $4B (2023) from Merchant Trading
Citadel’s commodities business generated approximately $8 billion in 2022—roughly half the firm’s total profits—and over $4 billion in 2023. The edge: physical natural gas infrastructure.
Sebastian Barrack’s build-out of Citadel Energy Marketing created merchant trading capabilities (storage, transportation) that converted volatility into structural alpha. Ken Griffin recruited a 20-person team of scientists and meteorologists in 2018 whose weather forecasts drove positioning ahead of gas price spikes. The 2022 Russia-Ukraine shock created exactly the asymmetric setup this infrastructure was designed to exploit.
Execution detail: European natural gas and North American physical trading were primary contributors. The merchant arm’s ability to store and transport gas provided optionality that purely financial players lacked.
Vitol: $15.1B (2022) + $13B (2023) from Diversified Physical Flow
Vitol reported $15.1 billion in net profit for 2022 and $13.2 billion in 2023. Trading volumes: 7.3 million barrels/day in 2023 of oil and products, plus approximately 17.6 million tonnes of LNG.
The alpha driver wasn’t directional oil bets—it was capturing basis differentials across fragmented supply chains. Vitol’s global storage network (16 million cubic meters) and customer relationships created informational edges. When Europe pivoted from Russian gas, Vitol’s LNG infrastructure positioned it to capture spreads between U.S. Henry Hub prices and European TTF contracts.
Additional profit centers: Power generation through VPI holdings (1,240 MW capacity at Immingham), refining margins, and physical arbitrage across regional price dislocations.
Pierre Andurand: Historical Template for Energy Alpha
The playbook for energy-focused commodity funds was established decades earlier. BlueGold Capital returned 210% in 2008 and 55% in 2009 through timing both sides of oil’s parabolic move. Andurand shorted crude at $147 then covered near $40. The edge: discretionary macro overlaid with physical market intelligence from prior roles at Goldman Sachs, Bank of America, and Vitol.
This same combination—physical market relationships plus macro positioning—drove 2022-2023 energy profits. Current positioning on copper: predicting $40,000/tonne within five years based on supply constraints and electrification demand.
Execution lesson: Andurand’s 2024 cocoa trade (+50% on flagship fund) demonstrated the strategy’s continued viability, though 2025 losses of -57% YTD highlighted liquidity risks in concentrated agricultural positions.
Andy Hall: Contango Storage Trade (Historical Case Study)
Understanding curve structure was critical in 2022-2023, but the template was set decades earlier. Hall earned a $100 million bonus in 2008 trading for Phibro. Between 1997 and Citigroup’s sale, Phibro was profitable in 80% of quarters, accumulating $4.4 billion in gains.
The defining 2009 trade: Hall bought millions of gallons of oil and rented supertankers for offshore storage, exploiting the contango curve when spot prices traded at steep discounts to futures. This wasn’t speculation—it was positive carry structured as physical arbitrage. The same principles applied when storage economics in 2022-2023 created similar opportunities.
Trafigura: $7.4B (FY2023)
Record net profit of $7.4 billion in FY2023, with 2022 revenue of $318.5 billion (+38% YoY). Physical volumes: 6.6 million barrels/day.
Strategy parallel to Vitol: diversified flow trading with embedded optionality in midstream assets and customer contracts.
While energy markets captured the majority of trading profits due to Russia-Ukraine supply shocks, metals markets delivered the most dramatic single-trade events—including the largest margin crisis in exchange history and regulatory interventions that erased billions in winning positions.
Industrial Metals: Forced Liquidations and Regulatory Edge Cases
LME Nickel Short Squeeze (March 2022): $19.7B Margin Crisis
Chinese steel tycoon Xiang Guangda’s Tsingshan Holding accumulated 100,000-300,000 metric tons in short nickel positions at $18,000-$19,000/tonne. Russia’s Ukraine invasion triggered margin calls totaling $19.7 billion—more than 10x the previous daily record.
The LME canceled $12 billion in trades, erasing all transactions above certain price thresholds. Elliott Associates claimed $456 million in damages; UK courts ultimately denied their appeal in January 2025.
Lesson: Counterparty and exchange risk in physical commodities can override P&L. Elliott was positioned correctly but regulatory intervention crystallized zero returns.
Glencore: $6.4B Trading Profit (2022)
Glencore Marketing EBIT: $6.4 billion in 2022 and $3.5 billion in 2023.
Technological edge: X-Sight platform with IoT sensors enabled algorithmic execution across metals markets. Integration of mining operations with trading desks created informational asymmetries.
Compliance note: Glencore paid $1.186 billion to CFTC in 2022 for oil market manipulation (2007-2018), the largest penalty in CFTC history at the time.
Goldman Sachs Aluminum Warehouse Delay
After Goldman acquired Metro International Trade Services in 2010, warehouse wait times increased from 6 weeks to 16+ months. Estimated consumer cost: $5 billion (2010-2013).
Mechanism: By controlling LME-approved storage, Goldman captured rent through storage fees while the queue artificially inflated aluminum prices. 2022 settlement with JPMorgan resolved litigation without admission.
Strategic insight: Physical bottlenecks in fungible commodities can be monetized through infrastructure control.
The extraordinary profits of 2022-2023 came with unprecedented regulatory scrutiny. Enforcement actions doubled, penalties reached record levels, and several prominent firms paid nine-figure settlements—demonstrating that aggressive commodity trading tactics carry material legal tail risk.
Regulatory Enforcement: The Cost of Edge
CFTC Actions
FY2022: 82 enforcement actions, $2.5 billion in penalties
FY2023: 96 enforcement actions, $4.3 billion in penalties
Largest 2022 case: Energy trading firm (Glencore) paid $1.186 billion for oil market manipulation (2007-2018).
Freepoint Commodities: $91M Settlement
December 2023 settlement: $91 million for illegally trading fuel oil based on non-public information.
Optiver: $14M for “Banging the Close”
Optiver engaged in manipulation on NYMEX in March 2007: 19 documented manipulation attempts over 11 days; 5 successful. Penalty: $13 million civil penalty + $1 million disgorgement.
Tactic: Aggressive orders at settlement to move benchmark prices in favor of existing positions.
While commodity specialists dominated energy and metals, diversified multi-strategy funds captured broad commodity beta across asset classes—demonstrating that systematic exposure to the supercycle didn’t require concentrated single-commodity risk.
Multi-Strategy Alpha and Hedged Macro
D.E. Shaw Returns
Composite Fund: +25% (2022), +9.6% (2023)
Oculus Fund: +20% (2022), +7.8% (2023)
BH Macro: +21.91% (2022)
Sterling shares returned +21.91% in 2022. AUM grew from $30 billion to $36.6 billion in 2023.
Third Point Q1 2022 Letter
Dan Loeb stated: “US oil and gas companies are particularly interesting” due to “ill-conceived energy policies” and “well-intentioned but disastrous ESG initiatives.” Position: Initiated long Glencore for copper/nickel exposure.
Paul Tudor Jones (2022-2024)
October 2024 CNBC interview: “I think all roads lead to inflation... I am long gold. I am long Bitcoin. I think commodities are so ridiculously under-owned, so I’m long commodities.”
Agricultural commodities delivered the most concentrated short-term gains of the supercycle. Trend-following algorithms captured wheat’s parabolic move in Q1 2022, though the resulting food price crisis drew criticism when emerging market consumers bore the cost.
Agricultural Commodities: Trend-Following at Macro Inflection Points
Grain Spike: $1.9B (Q1 2022)
Top 10 hedge funds made $1.9 billion from grain and soybeans in Q1 2022. Execution: Trend-following algorithms bought wheat contracts weeks before Ukraine invasion.
Ethical controversy: The Guardian reported funds profited from food price crisis affecting emerging markets.
The 2022-2023 supercycle’s scale—$250 billion across two years—makes it easy to forget that commodity trading has produced spectacular failures when risk management breaks down. Three historical disasters provide essential context for understanding what separates sustained alpha from catastrophic loss.
Historical Disasters: Lessons in Risk Management
Metallgesellschaft (1993): $1.3-2.2B Loss
MGRM used “stack and roll” hedging on long-term petroleum contracts. Market shifted from backwardation to contango, creating massive rollover losses. Supervisory board unwound positions; company required bank consortium bailout.
Lesson: Hedging programs must account for curve structure risk and liquidity under stress.
Sumitomo Copper (1996): $2.6B Loss
Yasuo Hamanaka manipulated copper markets for a decade. Sumitomo paid $125 million to CFTC (largest penalty at that time) plus $33 million to other regulators. Total: $158 million settlement. Hamanaka received 8 years prison.
Mechanism: Concentrated long positions in physical copper combined with futures manipulation to squeeze shorts.
Amaranth (2006): $6B Loss
FERC issued show cause order proposing $291 million in penalties ($261 million for entities, $30 million for Brian Hunter personally). Settlement: $7.5 million (August 2009). Hunter separately paid $750,000 to CFTC in 2014 with permanent trading ban.
Core error: Concentrated natural gas calendar spread positions with inadequate risk controls.
Structural Takeaways for Practitioners
The $250 billion generated across 2022-2023 confirms three core principles:
Physical infrastructure creates persistent alpha. Citadel’s merchant trading and Vitol’s storage network converted volatility into structural edge. Pure financial positioning was insufficient—the winners owned the tanks, pipelines, and warehouses that controlled physical flows.
Regulatory risk is non-diversifiable. LME nickel cancellations erased profitable trades through force majeure. Glencore paid $1.2 billion for manipulation spanning a decade. CFTC enforcement escalated from $2.5B (FY2022) to $4.3B (FY2023), demonstrating that aggressive tactics carry material legal tail risk.
Curve structure matters more than direction. Contango storage trades (Andy Hall 2009) and backwardation roll losses (Metallgesellschaft 1993) highlight that commodities require physical market expertise beyond macro views.
Multi-strategy diversification captured broad commodity beta. D.E. Shaw (+25% in 2022) and BH Macro (+21.91% in 2022) extracted returns across energy, metals, and macro without concentrated single-commodity risk.
Liquidity constraints in agricultural/specialty markets. Andurand’s 2025 cocoa losses (-57% YTD) demonstrated that even fundamentally sound theses fail in illiquid markets under forced unwinding.
The 2022-2023 commodity supercycle rewarded firms with three capabilities: physical market access, robust risk management, and execution infrastructure beyond financial derivatives. Volatility created opportunities, but translation to realized P&L required the operational systems that Citadel, Vitol, and elite physical traders had built over decades.
As markets normalize toward $95 billion gross margins (2024 figures from Oliver Wyman), the central question for allocators is whether commodity alpha persists absent geopolitical shocks—or if 2022-2023 represented a once-in-a-generation structural break that won’t repeat until the next supply chain crisis forces markets into fragmentation. The historical pattern suggests that sustained alpha in commodities doesn’t come from predicting macro events, but from controlling the physical infrastructure that converts those events into profit.
📊 Want Deeper Quantitative Analysis?
This research took very long time of data collection, verification, and analysis. If you found value in this deep-dive, I publish exclusive quantitative research, trading strategies, and institutional-grade analysis on Patreon.
By joining, you’ll be supporting my work and motivating me to publish more content like this.
→ Join the Patreon community here
Connect with me:
LinkedIn | YouTube: The Mathematical Trader
For more quantitative finance research and systematic trading analysis.
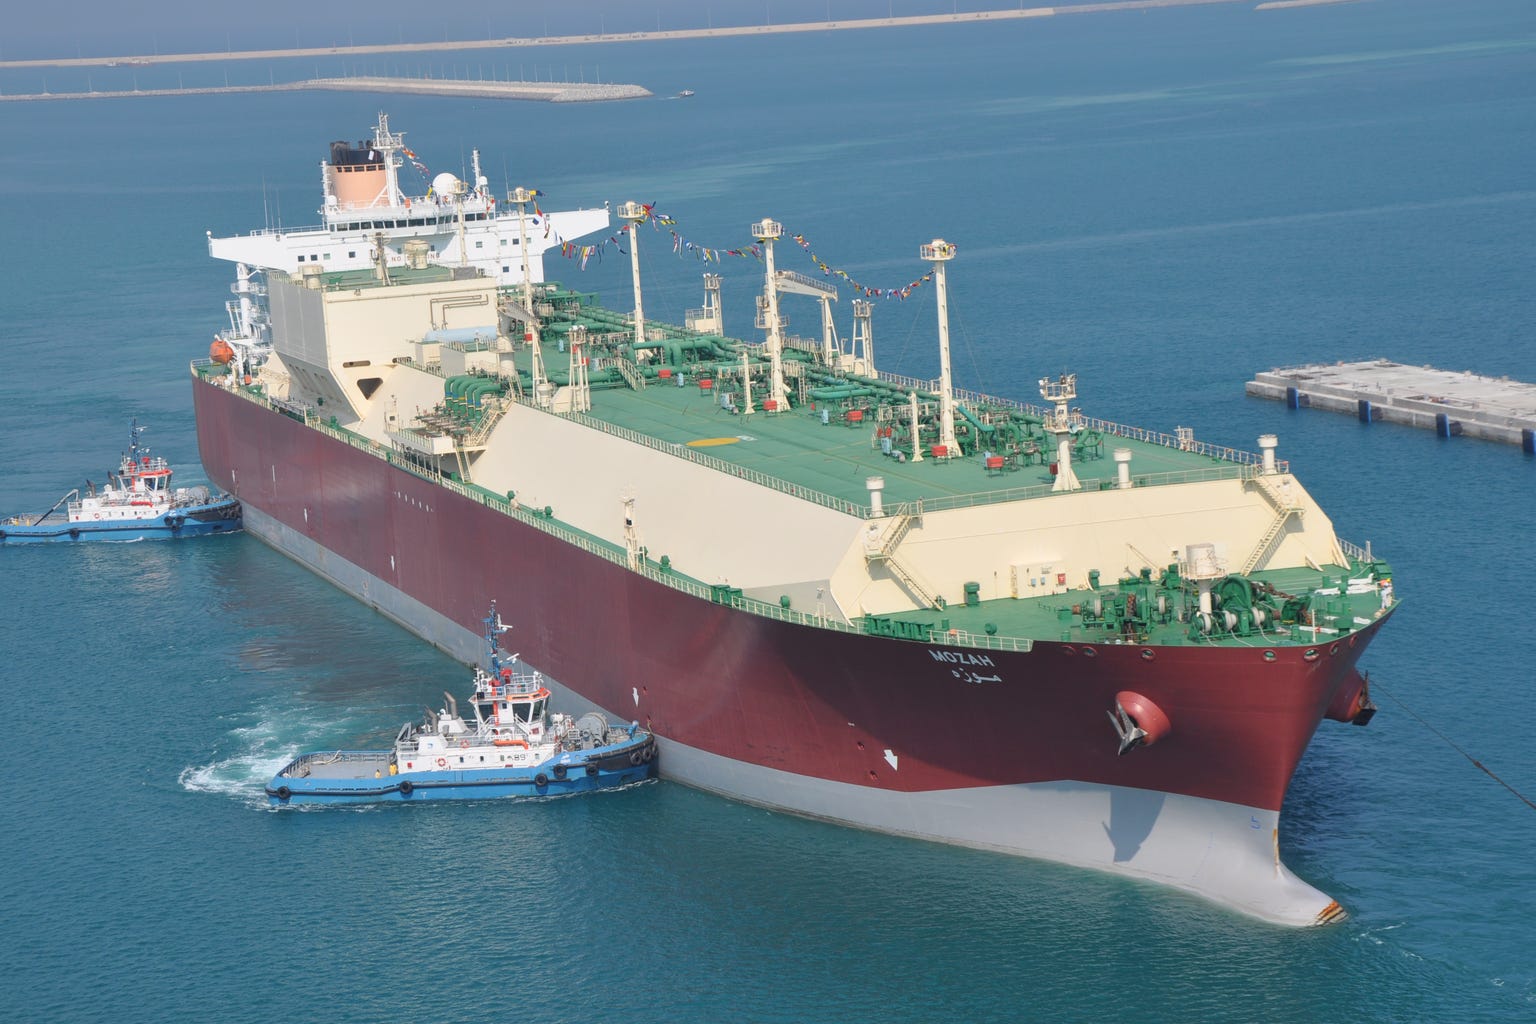
Cover photograph: Nakilat, CC BY-SA 4.0, via Wikimedia Commons.