



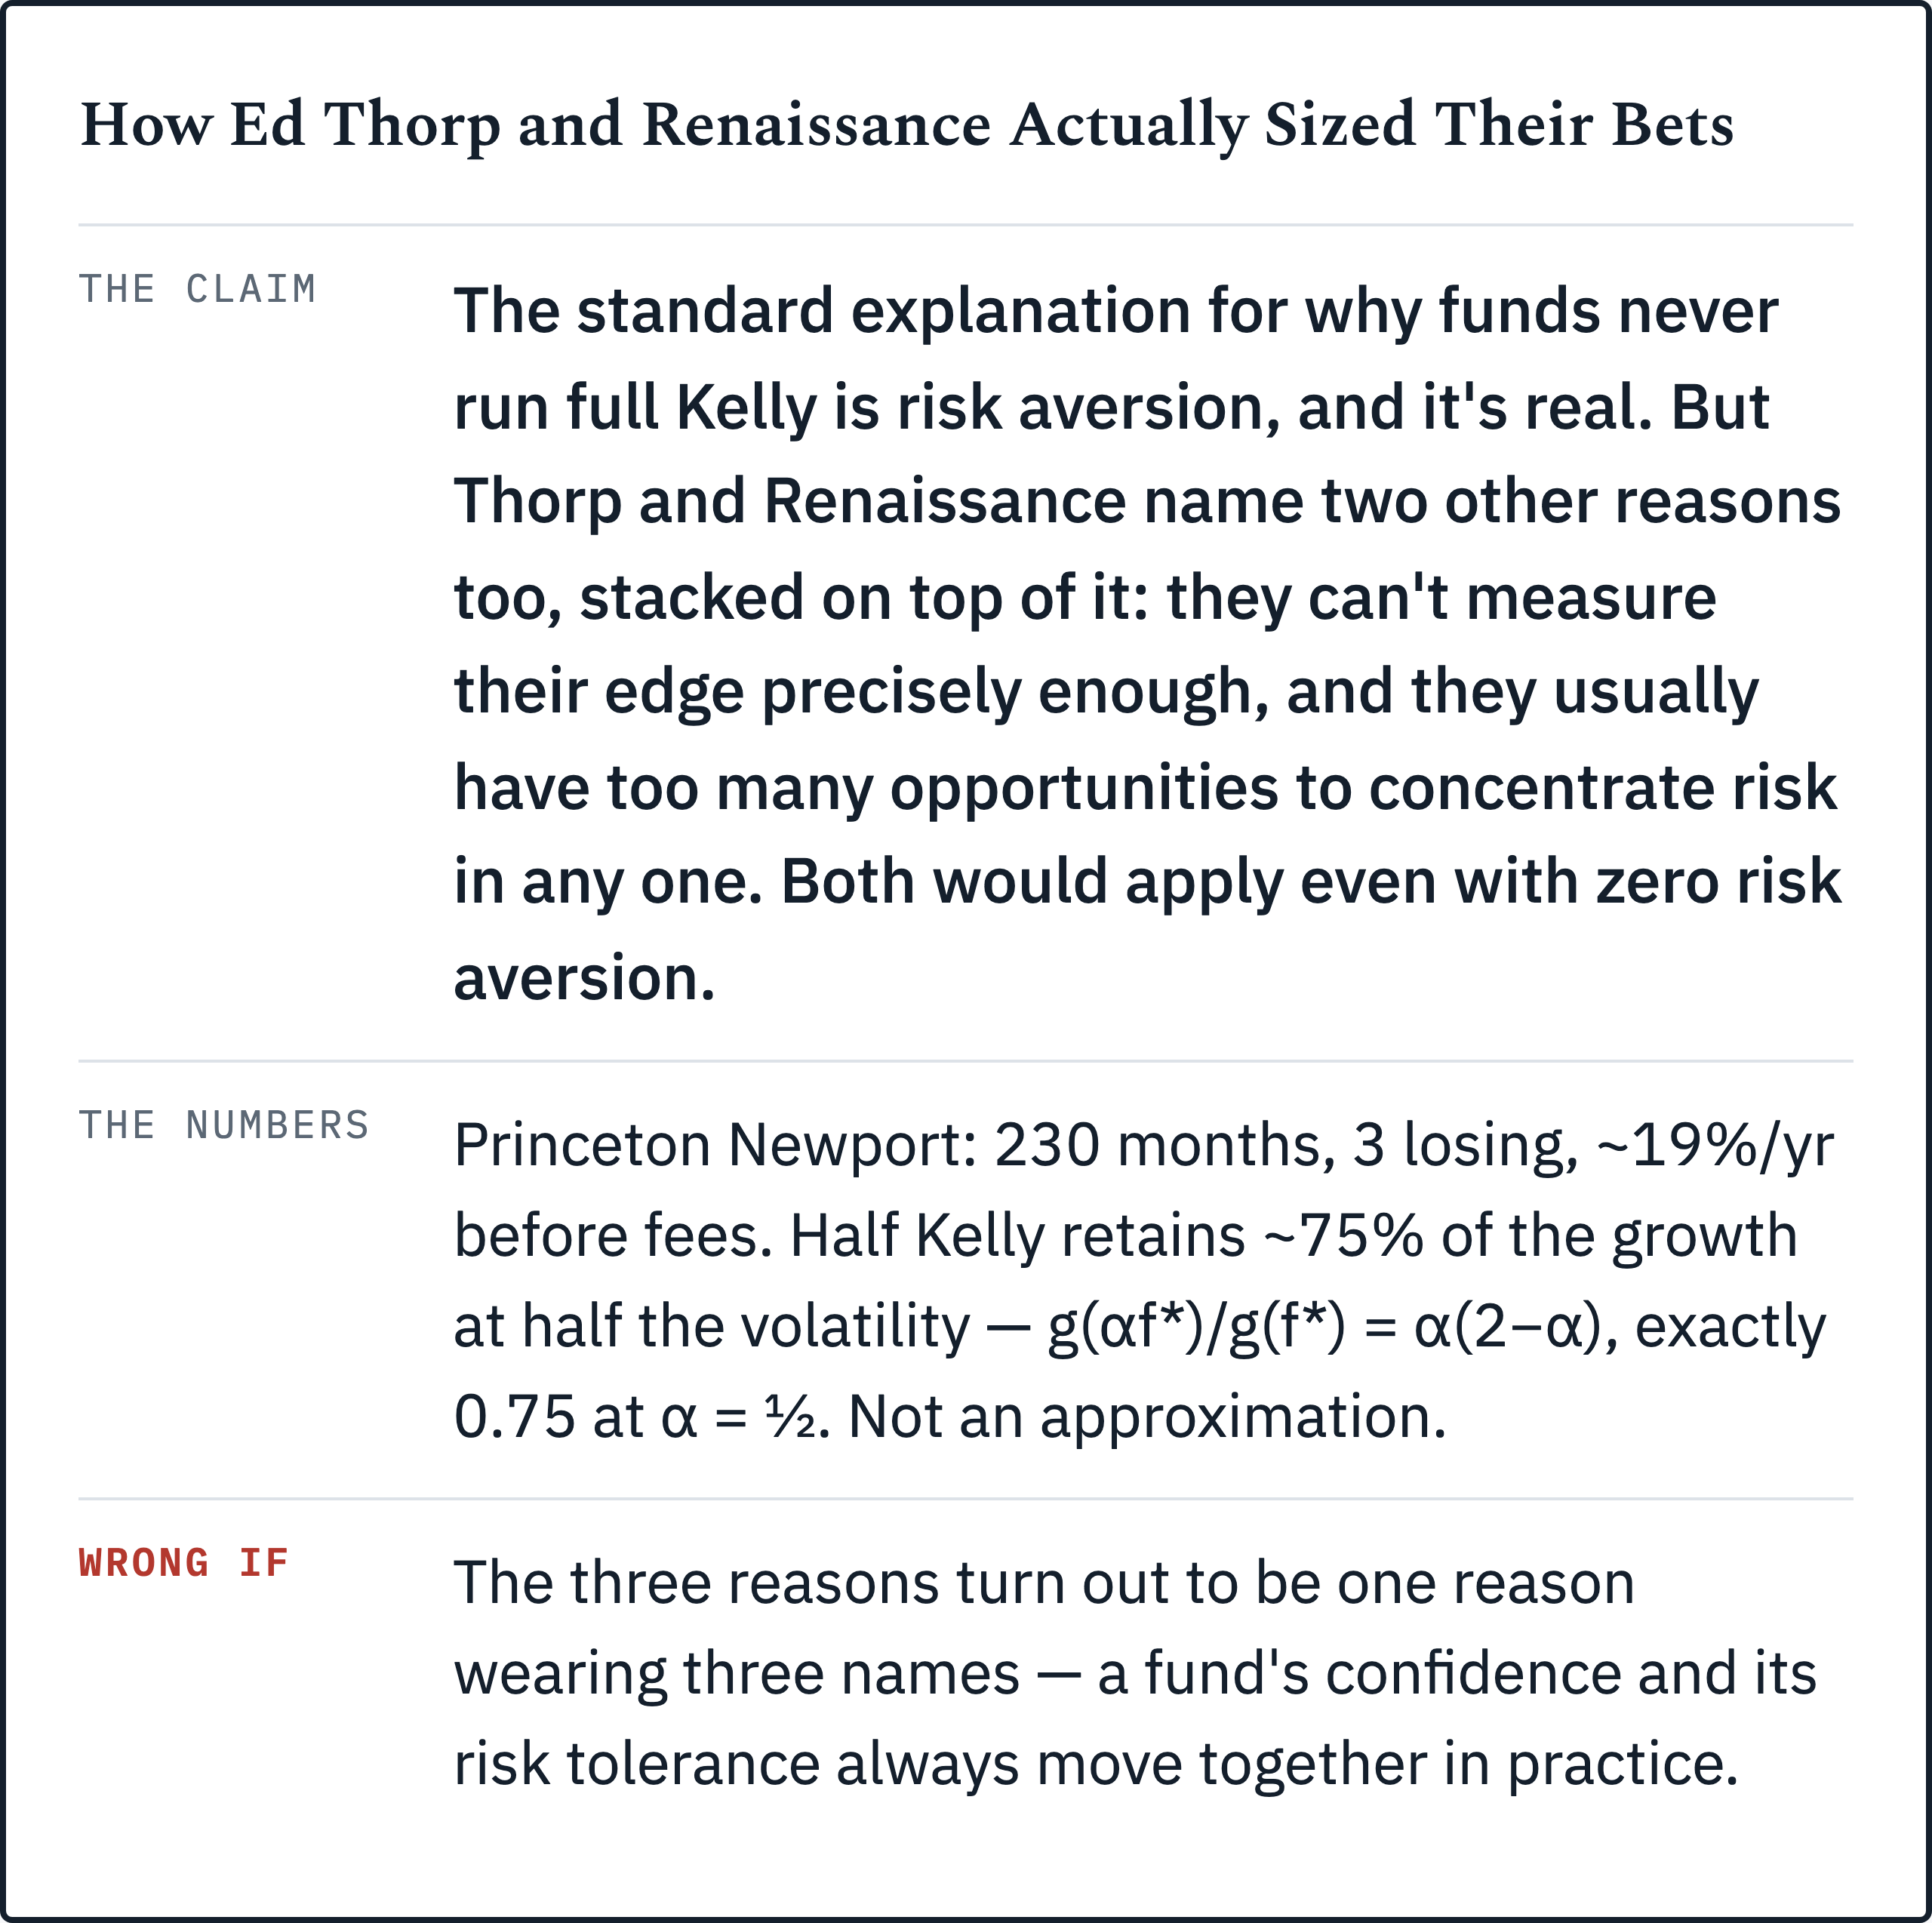
Ed Thorp ran Princeton Newport at a little over 19% a year for nineteen years, three losing months out of 230, without ever running the Kelly criterion at full strength. Neither did Renaissance after him. The standard explanation is risk aversion. Thorp and Renaissance’s own words name two more reasons stacked on top of it, and both would apply even to a fund with zero risk aversion.
Wall Street already made its peace with this formula, sort of
Quantitative finance mostly treats the Kelly criterion as a gambling curiosity that got lucky with a few famous names. The reputation sticks. I understand the instinct. The formula tells you to maximize the expected logarithm of your wealth. That is one specific utility function, and most investors do not actually hold it.
Paul Samuelson spent years arguing against using it as a general framework, across several papers responding to Kelly’s defenders. His core objection is a piece of utility theory. Growth optimal betting asymptotically beats every other strategy with certainty over infinite time. That says nothing about whether a rational, finite horizon investor should take it over one period, or ten A response to Professor Paul A. Samuelson’s objections to Kelly capital growth investing.
Here is the part that complicates the academics versus practitioners story I am about to tell. Samuelson did not reject fractional Kelly. In private correspondence, per the same source, he said half Kelly “explains the data better” than full Kelly and called it a toned down version that “provides a lot more security.” Half Kelly, mathematically, is equivalent to a specific risk averse utility function. Samuelson’s objection and half Kelly’s usual justification are not opponents. They are the same idea in two vocabularies. Language differs. The math does not.
So the fifty year fight I’m describing was never a clean argument with two sides. My read is closer to this: the field settled on roughly the right fraction for an incomplete reason. Risk aversion is the explanation everyone already had a vocabulary for. The other two reasons practitioners actually cite got folded into it, and nobody noticed they do not need risk aversion to exist at all.
There’s an odd split worth naming here too. Among poker players and sports bettors, the Kelly criterion is treated as close to gospel, and entire betting communities size every wager off it. Among institutional allocators, it registers mostly as a niche academic exercise. A poker player who plays the same game thousands of times a year with well estimated odds is close to the world Kelly actually describes. A fund allocating capital across dozens of loosely testable strategies is not. That gap is most of what this piece is about.
Three reasons, and only one of them is about nerve
Here’s my actual claim, stated more carefully than the standfirst can manage. Real Kelly sized books don’t run at full size, and risk aversion is a real part of why. But when the two practitioners I could find real documentation on, Ed Thorp and, less directly, Renaissance Technologies under Elwyn Berlekamp, explain their own reasoning, risk aversion is not the only thing in the room.
The first reason is the one everyone already knows. Full Kelly is more volatile than most people can stomach, and that is a legitimate preference. It is not a mistake. Risk aversion earns its place here.
The second reason is different. Full Kelly sizing assumes you know your true edge and your true covariance structure, and nobody ever does. A formula that sizes purely off a point estimate systematically overbets exactly the positions whose edge happens to be overestimated. That is a measurement problem, and it would matter even to an investor with zero risk aversion.
The third reason is different again. Say you have a wide opportunity set: dozens of only loosely correlated ideas instead of one big conviction. The arithmetic of spreading capital across all of them caps how much you would put on any single one. Whatever your risk tolerance says. Thorp’s own account of running Princeton Newport leans hardest on this third reason, and it’s the one the popular Kelly story almost never mentions.
None of that makes fractional Kelly bad. Risk aversion still counts. It is a real and sufficient reason on its own. My claim is narrower: the second and third reasons don’t need the first one to exist, they get attributed to it anyway, and that attribution error is why a poker forum and a finance PhD can describe the same practice with completely different mechanisms behind it.
A phone company’s gambling problem
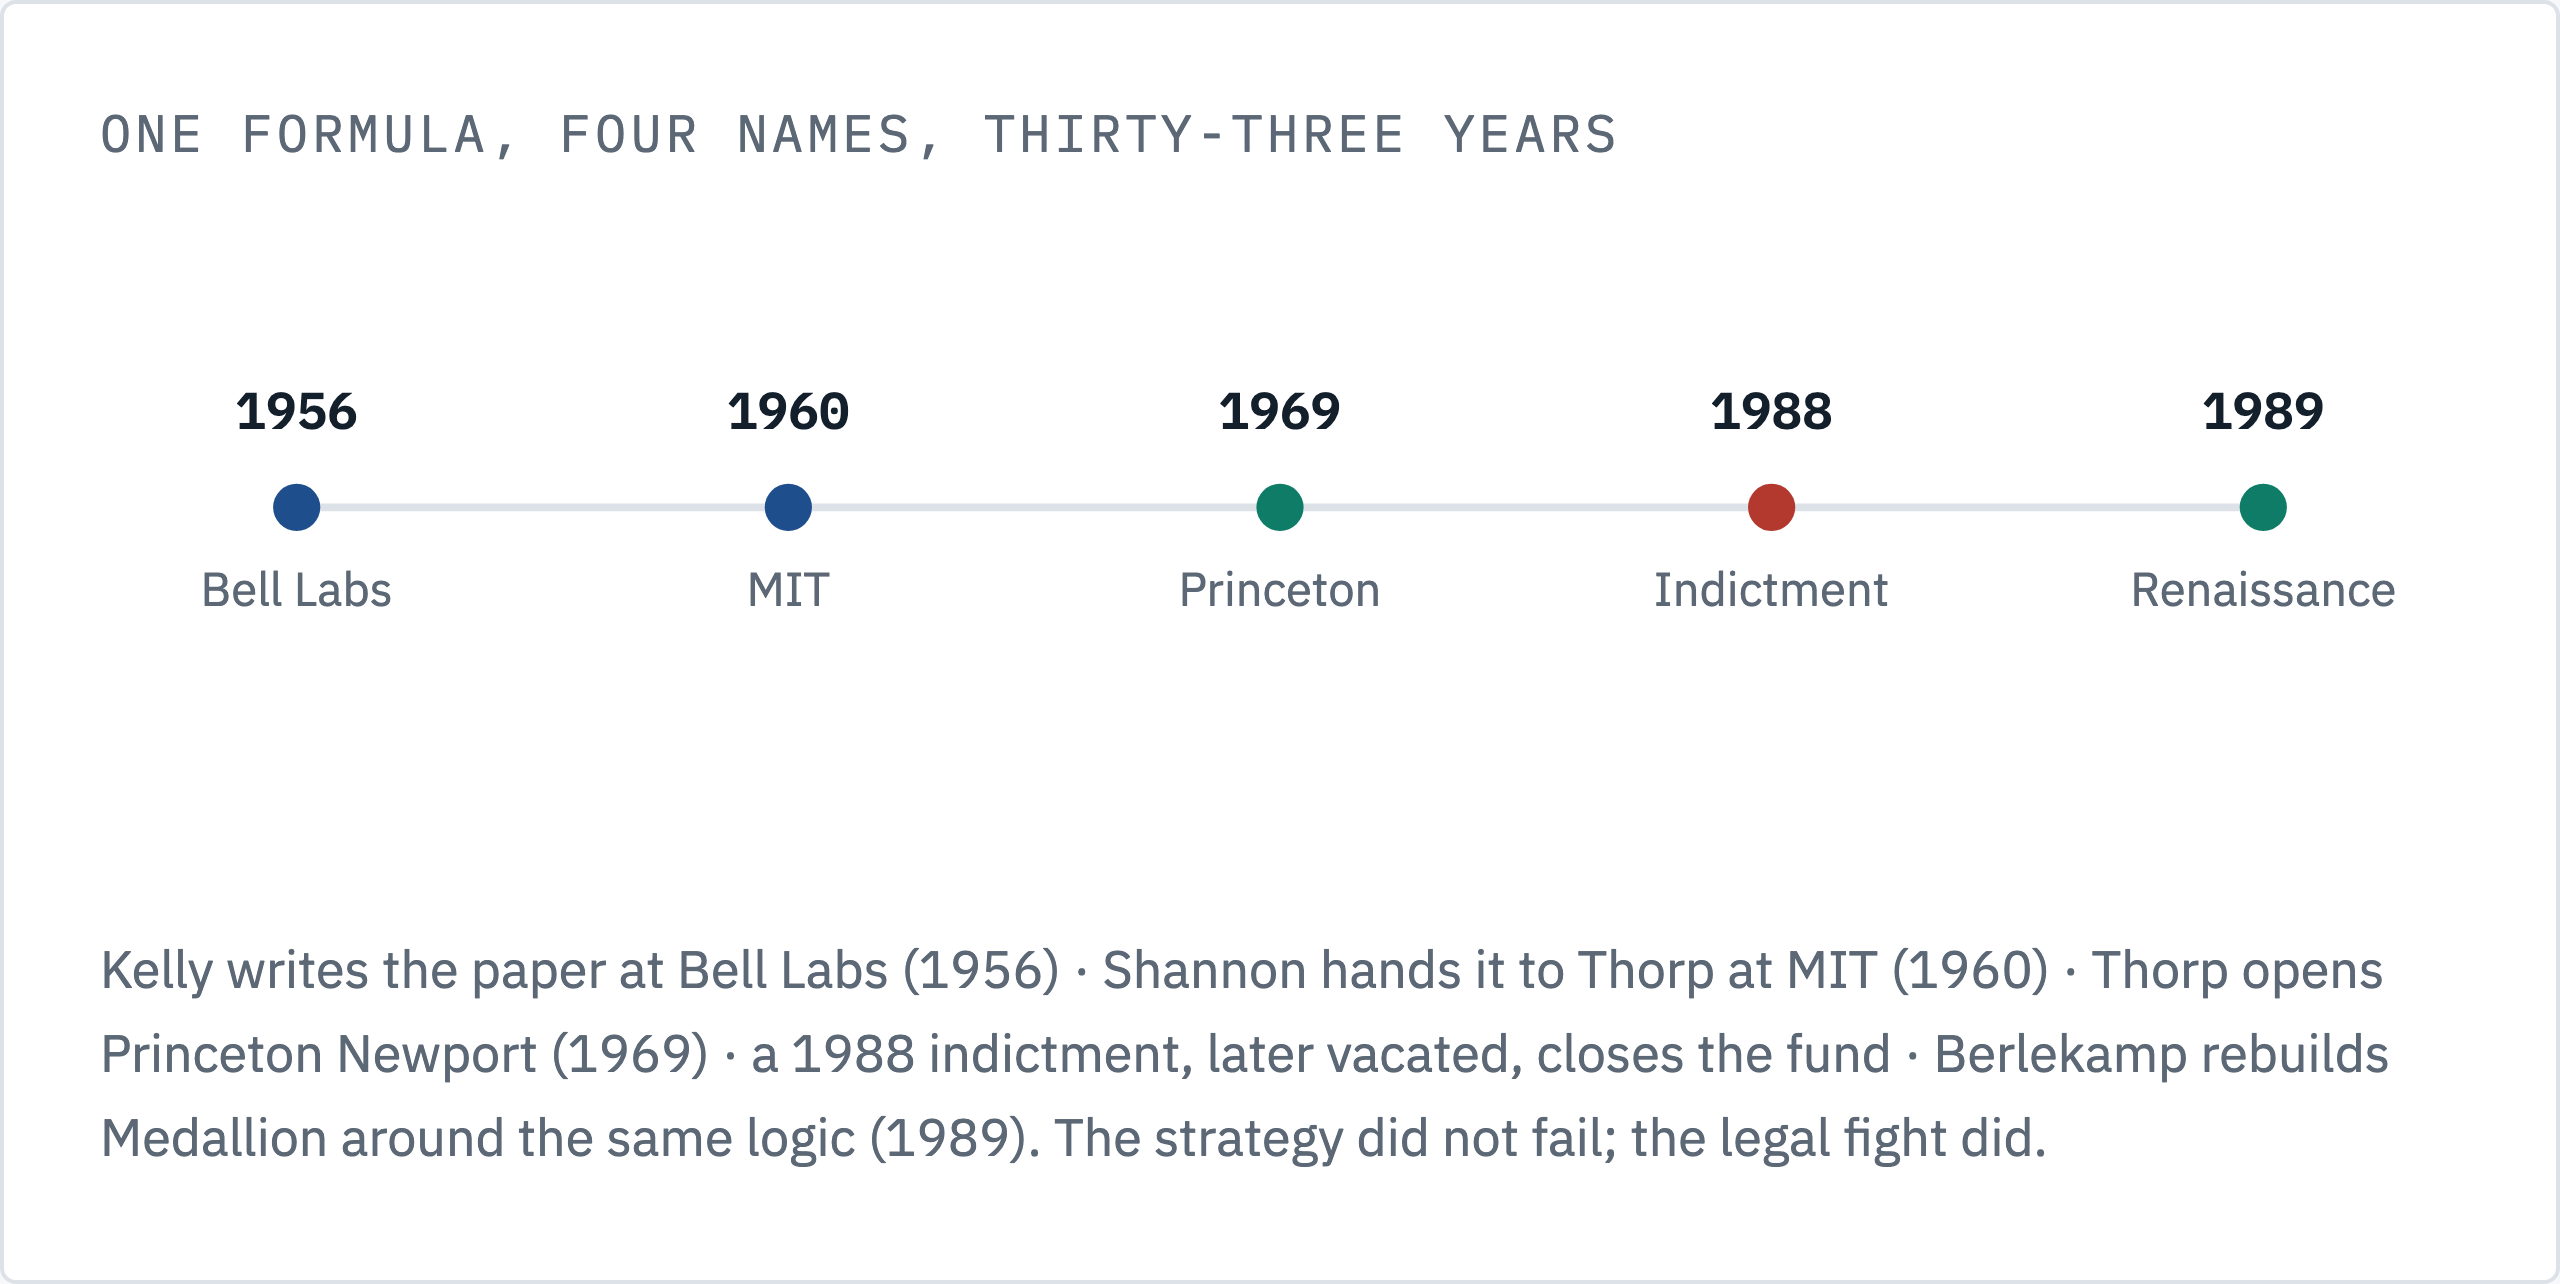
Lay the dates out in order and the transmission is short. 1956, Bell Labs. Kelly writes the paper. 1960, MIT. Shannon hands it to Thorp. 1969, Princeton Newport opens. Thorp starts trading the math for real. 1988, it closes. Not from a bad bet, from a court case. 1989, Renaissance. Berlekamp rebuilds Medallion around the same logic. Thirty three years, four names, one formula moving between them each time.
Start with the physicist. John Kelly built the formula at Bell Labs while working on Claude Shannon’s information theory. It was not built for portfolios. Kelly showed that a gambler who knows his true edge maximizes long run wealth by betting a fixed fraction of capital proportional to that edge. The derivation borrows directly from Shannon’s own math for the capacity of a noisy communication channel.
Kelly’s own title for the paper was “Information Theory and Gambling.” AT&T’s executives had it renamed to the blander “A New Interpretation of Information Rate.” They were worried the press would conclude Bell Labs was doing research to help illegal gamblers, since the company had spent decades leasing wires to the racetrack “wire services” that fed bookies John Kelly, Jr. and His Formula. Shannon is the one who pushed Kelly to publish it at all.
Ed Thorp learned about the paper from Shannon directly, in November 1960, while the two of them were colleagues at MIT. Worth getting that detail right, because it changes the story slightly. Thorp was not a student soaking up a professor’s idea. He held a math PhD from UCLA and was already an instructor on MIT’s own faculty when he told Shannon about a card counting system he had built for blackjack. Shannon pointed him at Kelly’s paper. The introduction changed everything. Thorp used it to compute exactly how much of his bankroll to bet on each hand once he had an edge, and that became the money management chapter of “Beat the Dealer.”
A few years later he moved the same logic into markets, first warrant pricing and convertible arbitrage, then in 1969 into Princeton Newport Partners, a fund he ran with Jay Regan for nineteen years. Thorp’s own account, given from memory in a 2017 interview, describes 230 months of operation with three losing months, none worse than about 1%. It compounded a little over 19% a year before fees, against a Dow that “did about half that” over the same stretch Episode #39: Ed Thorp, “If You Bet Too Much, You’ll Almost Certainly Be Ruined”.
None of that cluster is independently audited. The months, the losing count, the 19%, the Dow comparison. It’s all one man’s recollection of his own fund’s record, offered as such. I’m treating the whole cluster that way, rather than hedging only the headline number and letting the rest ride as though it were somehow sturdier.
The fund closed in 1988, and the reason deserves precision rather than a gesture. A federal grand jury indicted five Princeton Newport principals, Regan among them, plus a Drexel Burnham banker, on RICO and related charges in 1988. All were convicted in 1989. The Second Circuit vacated the RICO counts and most of the rest on appeal in 1991, on the finding that the trial judge’s jury instructions on wire and securities fraud were erroneous United States v. Regan, 937 F.2d 823 (2d Cir. 1991), and the remaining charges were dropped the following year. Thorp himself was never charged. Whatever the merits of the case, a legal fight that started with a 1988 indictment and only fully resolved in 1992 is what ended the fund. The strategy did not fail. It came after the winning record above was already built.
Berlekamp, and the reason his fund actually turned around
The more interesting transmission happened next, and I want to be more careful with it than I first was. The two figure hedge I originally reached for here was wrong, not honest. Elwyn Berlekamp, whose MIT doctoral committee included Shannon among its members, took over trading at Renaissance Technologies’ Medallion fund as it restructured in 1989.
The commonly reported record is not a dispute between two strong figures. 1989 was Medallion’s only losing year, roughly a 4% loss, while the rebuilt system was still coming online late in the year. 1990, the system’s first full year, returned about 55.9% net. A loss immediately followed by a large gain the year the new approach ran a full cycle is a cleaner story than the one I told before. It also happens to be the one the record actually supports. The correction improves the story.
What I cannot fully document is why Berlekamp sized the way he did. That he scaled down for the same estimation uncertainty reason Thorp names is my inference, not his stated position. I could not find a Berlekamp quote making that case directly. What is documented: he pushed toward much shorter holding periods, compressing the fund’s average trade from roughly a week and a half to closer to a day and a half. That is a variance and turnover argument more than a confidence argument, and it is consistent with the third reason above, spreading risk across far more independent bets, whatever its stated motivation actually was.
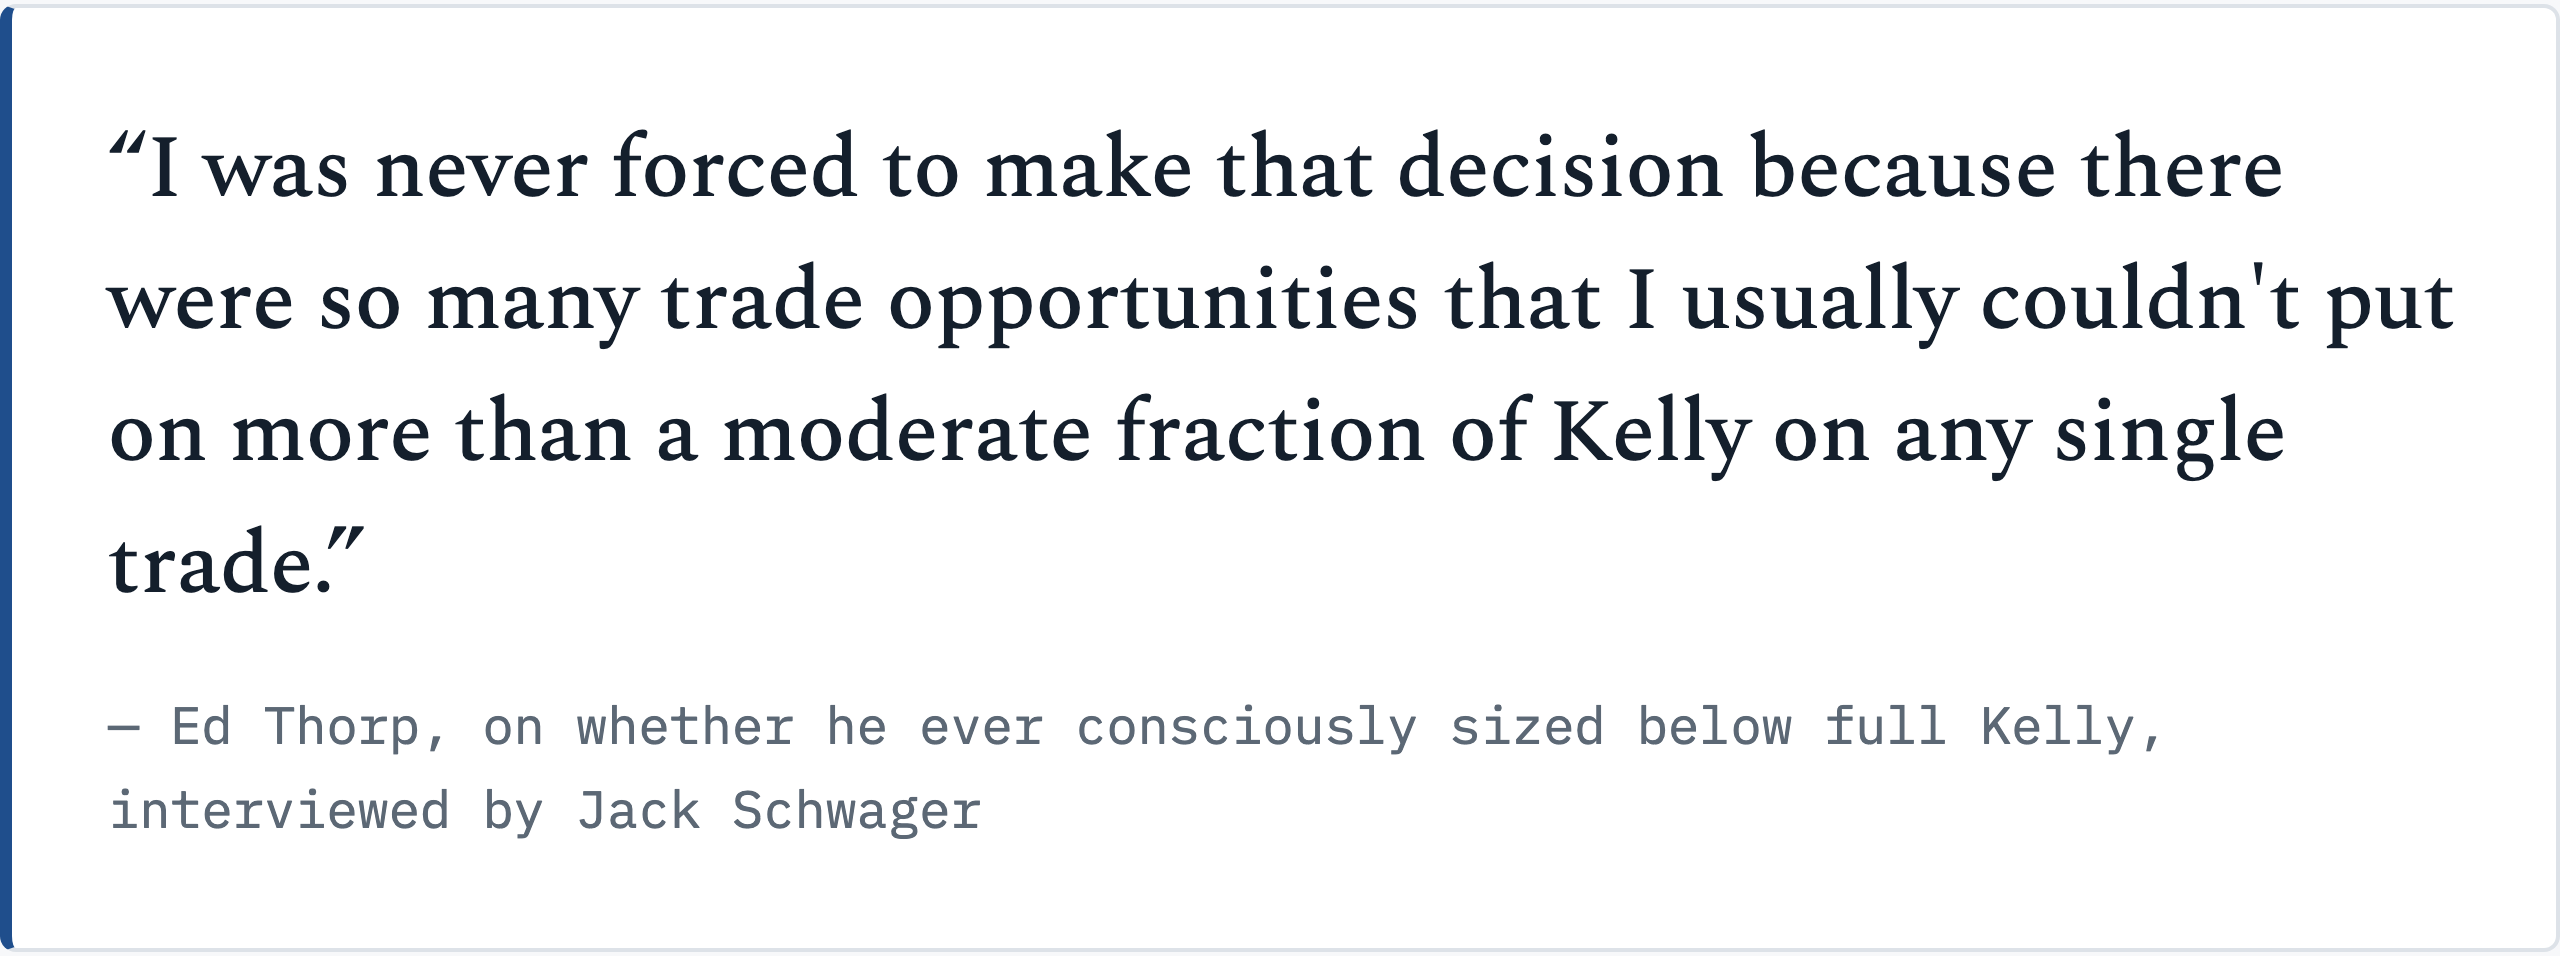
Thorp’s own words make the third reason concrete in his own case. Schwager asked whether he’d ever consciously chosen to size below full Kelly. Thorp’s answer: “I was never forced to make that decision because there were so many trade opportunities that I usually couldn’t put on more than a moderate fraction of Kelly on any single trade” Ed Thorp, Jack Schwager, and the Kelly Criterion. He isn’t describing measurement uncertainty, and he isn’t describing risk tolerance. He’s describing an opportunity set wide enough that the fraction fell out of the arithmetic of diversification on its own, before either of the other two questions ever came up. That’s a real, third mechanism, sitting in the article’s own best quote the whole time.
What Thorp actually said, in full, about why he scaled back
Here’s the same interview’s other load bearing passage. It deserves the full sentence, not the compressed version I used the first time I wrote this. “Now go to Wall Street. We are not able to calculate exact probabilities in the first place. In addition, there are things that are going on that are not part of one’s knowledge at the time that affect the probabilities. So you need to scale back to a certain extent because overbetting is really punishing, you get both a lower growth rate and much higher variability. Therefore, something like half Kelly is probably a prudent starting point.”
Read in full, Thorp names the measurement problem and the volatility problem in the same breath. He chooses neither over the other. His written work makes the same move explicitly: in his own 2006 chapter on the subject, he writes that most practitioners “strongly prefer the increased safety and psychological comfort of half Kelly... in exchange for giving up 1/4 of their growth rate,” and separately that investors facing genuine uncertainty about their edge should “further limit” their sizing beyond whatever risk tolerance alone would suggest. Further limit. He’s stacking the two. Not substituting one for the other.
So here’s the honest version of my discriminator. Risk tolerance sets a starting point. Measurement uncertainty pushes further down from there. The two are conceptually separable even when they land on a similar number. A 2017 paper on Kelly betting under estimated, rather than known, outcome probabilities backs the measurement half of that mechanically. Replacing true probabilities with estimates leads to overbetting, a result the paper traces to earlier work by MacLean, Ziemba and Blazenko, because outcomes whose edge happens to be overestimated look more attractive than they actually are. A formula that sizes purely off the point estimate has no way to tell a well measured edge from a lucky guess Kelly betting on horse races with uncertainty in probability estimates. That mechanism doesn’t care how an investor feels about volatility. It would bite a risk neutral investor just as hard. Preferences do not enter the calculation.
I built the actual growth-rate curve behind that mechanism. Computed at seven fractions of full Kelly, from one plain, checkable edge, it shows exactly where overbetting stops being forgiving and turns the whole strategy negative: the Kelly fraction model, worked in full, on Patreon.
One more thing worth naming here. This piece of the mechanism doesn’t decay the way a crowded trade does. A mispriced spread closes as more capital chases it. Measurement discipline isn’t like that. A hundred funds correctly discounting their own uncertain edges doesn’t erode the discipline of the hundredth. It just means more of the industry is doing the arithmetic straight, which is a different kind of crowding than the kind that kills a trade.
What Princeton Newport doesn’t prove, and what the record shows on the other side
Two gaps here, plus a correction to something I got backwards the first time through.
First, I claimed I wasn’t aware of a documented case of a fund running close to full Kelly on a wide book. That was wrong. The record sits inside the same Kelly-advocate literature I’ve already cited. Warren Buffett, George Soros and John Maynard Keynes are all discussed there as investors who ran close to full Kelly, or something close to it.
Keynes is the best documented of the three. Running King’s College Cambridge’s endowment from 1924 to 1946, he kept equity weightings above 70% against insurers of the era running barely 10%, and generated an annualized alpha over the period estimated at 8%. He also lost heavily in the 1929 crash, before compounding through the rest of the period Secrets of Keynes’ Winning Ways Revealed. On the other side, Victor Niederhoffer is documented as running well past full Kelly before a series of blowups.
Why those examples don’t settle my narrower claim: all three of the full Kelly names ran concentrated books, a handful of high conviction positions, not the wide, many idea book my third mechanism is actually about. A concentrated full Kelly investor and a wide, diversified one are answering a different sizing question. I should have said that the first time, instead of claiming no examples existed at all.
Second, Princeton Newport’s own record tells us less than it looks like it does. Three losing months in nineteen years is not much of a stress test. A fractional Kelly book that never meets a real tail event during its own run hasn’t proven it can survive one. It’s only shown that it didn’t happen to face one. The record is thin exactly where it matters most. Convertible arbitrage as a category did suffer real drawdowns in later decades, after Thorp’s fund had already closed. I haven’t traced whether a book sized his way would have survived those episodes.
The test that would actually separate these reasons
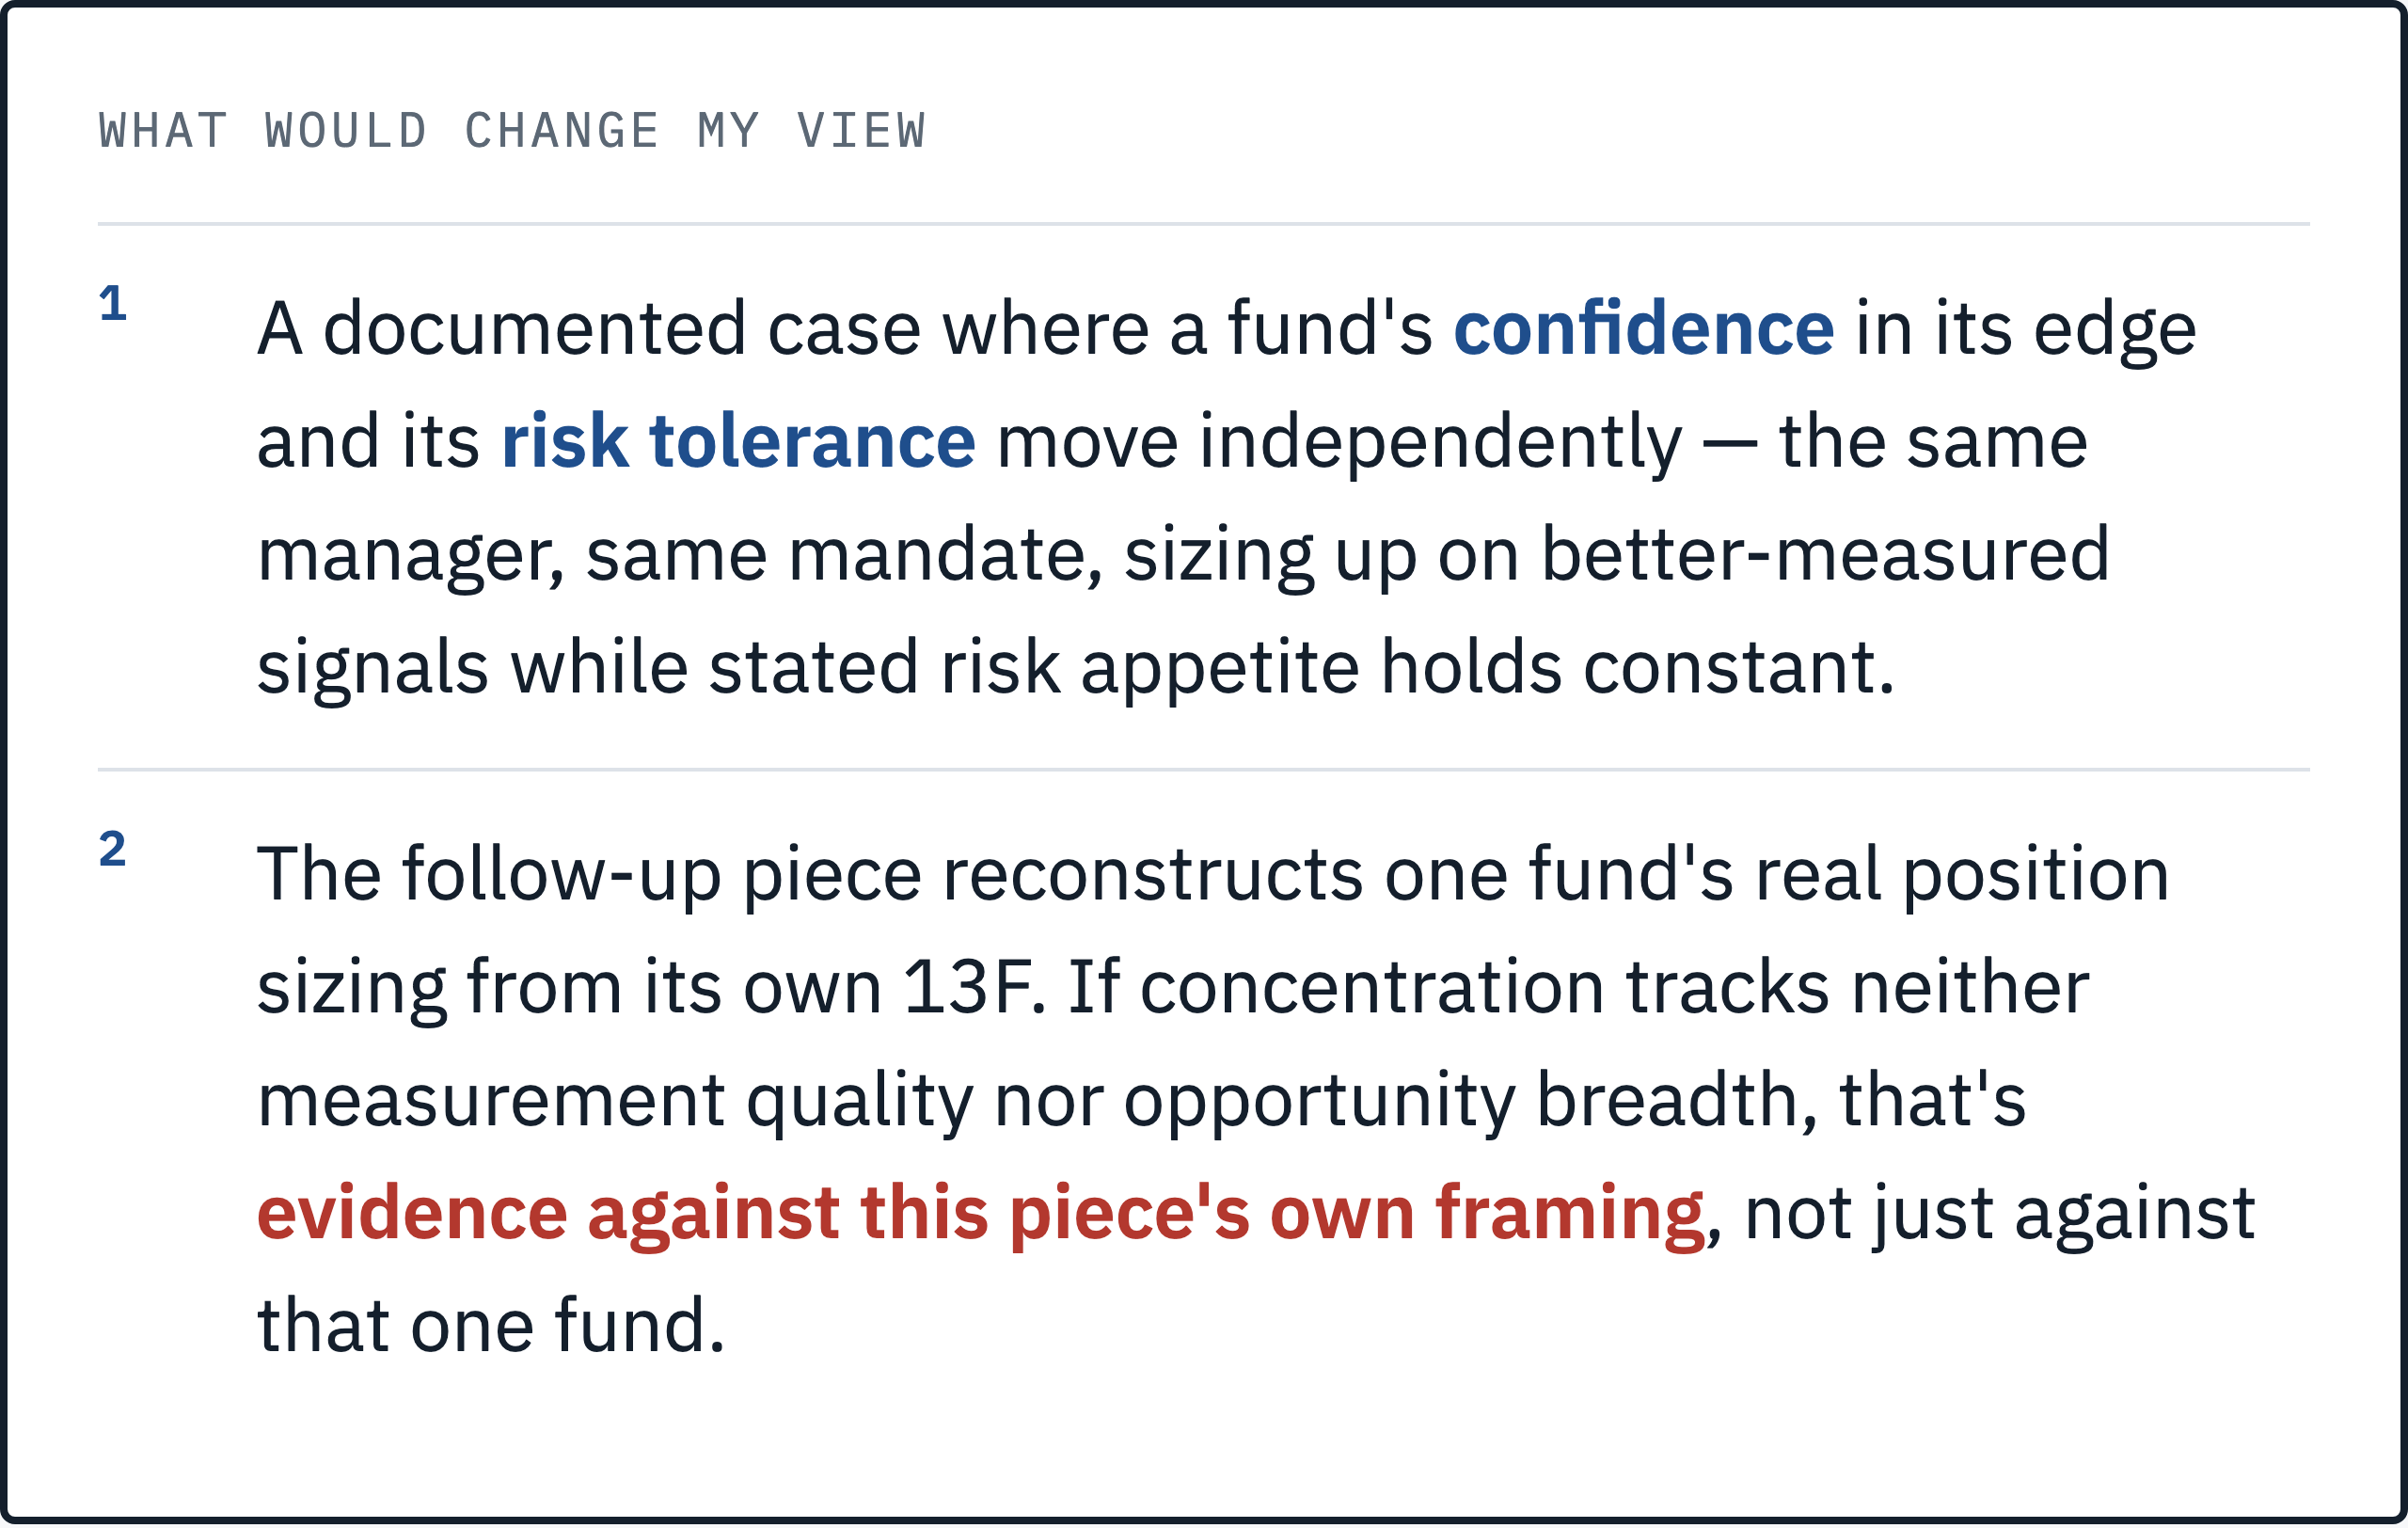
Here is a way to actually test the difference. If the measurement uncertainty reason is doing real, independent work, a fund with a well measured, densely back tested, statistically dense edge, something closer to a systematic signal book than a discretionary conviction, should be willing to size closer to full Kelly on that specific signal than on noisier, harder to verify bets run through the same nominal formula. That’s a checkable asymmetry between two funds with identical risk tolerance and different confidence. It’s exactly the case a pure risk aversion story can’t distinguish.
I don’t have a clean documented instance of that specific comparison, one fund’s own fraction moving with its measured confidence while its stated risk tolerance holds constant. I looked. The examples I do have, the concentrated full Kelly investors and the over Kelly blowups, answer a cruder version of the question.
There’s also a real survivorship problem sitting under any version of this test, and I am not going to dress it up. A fund that ran too aggressively and failed doesn’t usually publish the retrospective explaining what it learned. So the population of funds willing to talk about their own sizing skews toward the ones who scaled back and lived to describe it. That cuts against my own framing more than I’d like. It does not make the measurement story wrong. It does mean I am reasoning from a sample that already excludes the strongest counterexample, and a more skeptical reader is entitled to weigh that against everything above.
What I’m watching
The lesson travels. The practical takeaway extends past anyone running formal Kelly math. If you size positions off an estimated edge at all, the size should track how confident you actually are in the number and how many other opportunities you’re weighing it against. Not a fixed multiple applied to every idea in the book out of general caution. A signal with ten years of dense, out of sample evidence and one you believe just as strongly on three months of noisy data shouldn’t get the same fraction of capital, even when your point estimate of the edge looks identical on both. And a single high conviction idea shouldn’t get the same sizing logic as one of forty ideas competing for the same book.
I’m working on a follow up for paid subscribers that looks at a specific fund’s publicly disclosed long equity positions against its own stated risk framework. I want to be upfront about the limit of that exercise before I’ve written it. A 13F shows quarter end, long only, US listed holdings with a 45 day lag. The filing has limits. It can’t directly reveal a Kelly fraction, a short book, or leverage. What it can show is relative position sizing across a fund’s disclosed book, a real if partial window into whether concentration tracks anything like conviction or measurement quality. I’ll say plainly in that piece what the data can and can’t support.
Which of the three reasons actually drives your own position sizing when you’re least sure of an edge? How much it would hurt to be wrong. How sure you are of the number in the first place. Or simply how many other ideas are competing for the same dollar.
Further reading
Jim Simons’s Famous Math Never Built Renaissance Technologies. A Coding Theorist’s Did., the fuller account of the coding theorist whose sizing discipline rebuilt Medallion.
Morgan Stanley Invented Pairs Trading in 1987. D.E. Shaw and Ed Thorp Proved It Wasn’t the Point., the same Thorp discretion applied to a different edge.
Renaissance Keeps Medallion. AQR’s Founder Calls the Rest Regular Quants., the capacity ceiling that makes the third reason in this piece bite hardest at Renaissance specifically.
The Patreon note is a separate piece of work rather than a deeper cut of this article. It takes the growth-rate model and works it end to end, open to everyone. Members get one on every piece; the paid notes carry the second trade, the stress test and the model behind the levels.
→ Read the Kelly Fraction Model note, or join the Patreon community for every note.
Navnoor Bawa · LinkedIn · The Mathematical Trader on YouTube
Cover photo: George Bergman · CC BY-SA 4.0, adapted (cropped) · via Wikimedia Commons

Figures and quotes in this piece are drawn from Ed Thorp’s own retrospective accounts, two interviews, treated throughout as recollection rather than audited record, the documented record of Renaissance Technologies’ 1989-1990 transition, and the academic literature on Kelly betting under both risk preferences and parameter uncertainty. Where a claim rests on a single narrator or could not be independently verified, that is stated directly in the text rather than left for the reader to discover.