


This is a detailed research piece. If you find value in institutional-quality hedge fund analysis, support this work on Patreon.
The Architecture
Michael Platt’s BlueCrest Capital Management operates as a family office managing $3.9 billion in partner capital with access to $15 billion in total capital allocations (implied trading power ratio of allocations ÷ partner capital ≈ 3.85x). The firm runs multiple independent trading pods across rates, FX, and commodities. After returning external capital in 2015–2016, BlueCrest has generated outsized returns unavailable to public investors.
Sources: Bloomberg Billionaires Index, UK court documents
2014–2016: The Collapse That Created the Family Office
BlueCrest’s current structure exists because of a crisis—not despite it.
The Decline
Peak AUM: $37 billion
Late 2015 AUM: $8 billion (-78% collapse)
Flagship BCI returns: Underperformed, triggering mass redemptions
In December 2015, Platt announced BlueCrest would return $7-8 billion in external capital and convert to a private partnership. He cited evolving fee structures, the cost of retaining top talent, and investor constraints as reasons.
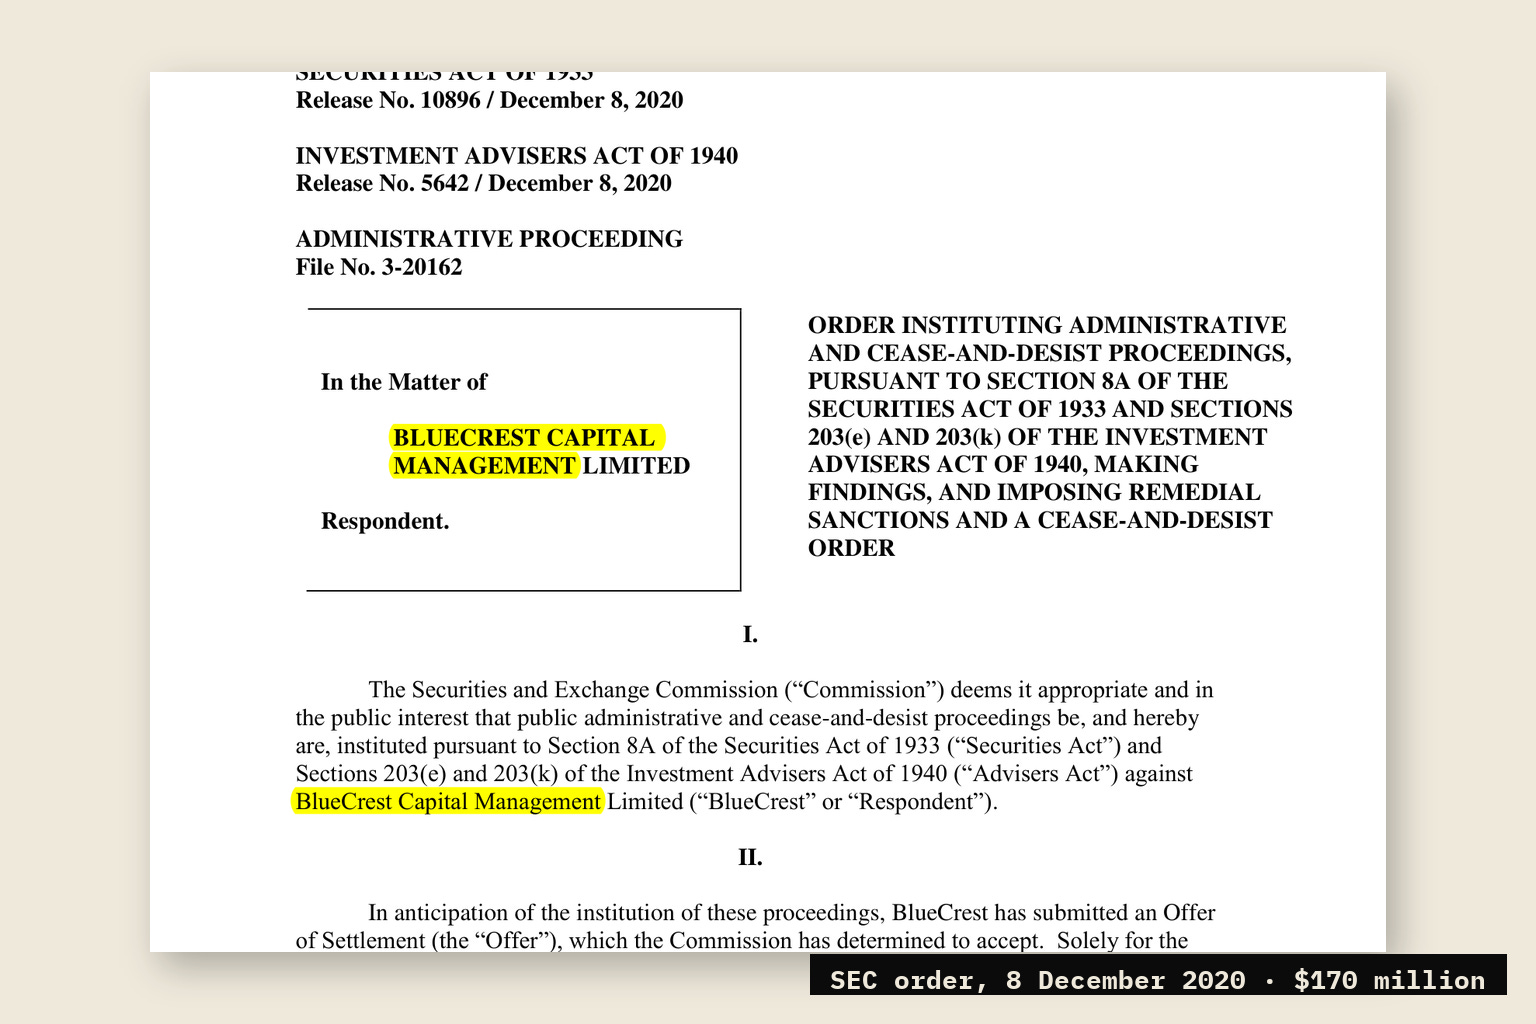
The Scandal (SEC Order, December 2020)
The SEC charged BlueCrest with transferring its best traders from the external fund (BlueCrest Capital International) to an internal fund (BSMA Ltd.) that primarily benefited partners and employees. External investors were left with an “underperforming algorithm” that replaced the human traders.
Regulatory Settlements
$170 million SEC settlement (December 2020)
$101 million FCA redress for UK investors
The SEC found that BlueCrest failed to disclose the conflict of interest: partners personally benefited from the internal fund while external clients received inferior performance.
The Pivot
Once external capital was eliminated, performance reversed immediately:
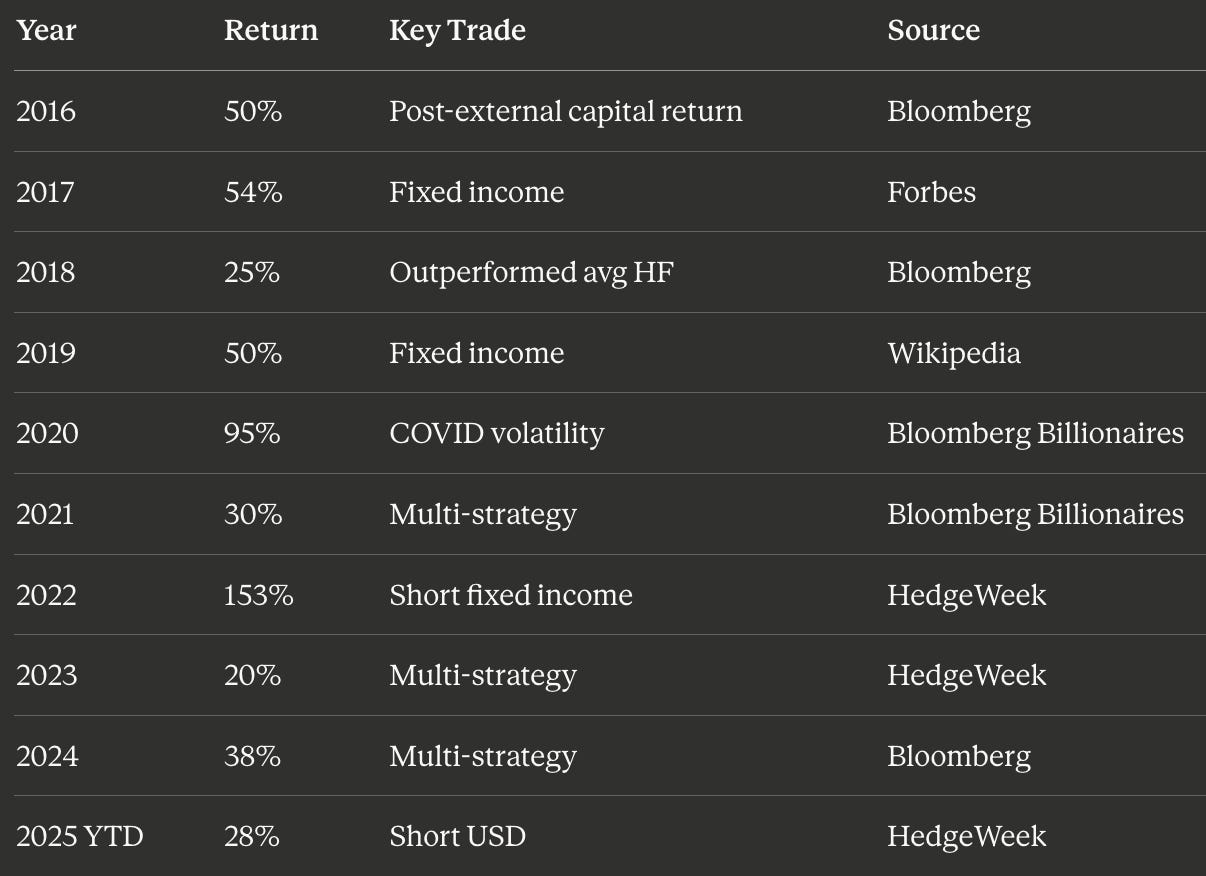
2016: +50%
2017: +54%
2020: +95%
2022: +153%
The family office structure (free from liquidity demands, disclosure obligations, and investor constraints) enabled the outsized returns that followed.
Sources:
2022: The $6B Bond Short
Return: 153%
Estimated Profit: ~$6 billion (calculated as $3.9B × 153% = $5.97B)*
Position: Short fixed income
BlueCrest anticipated Fed rate hikes before consensus. As 10-year Treasury yields climbed from 1.5% to 3.9%, the fund’s leveraged short position captured the bond market collapse.
Note: Profit figure is an arithmetic calculation based on reported capital and returns, not a disclosed audited figure.
Sources:
2025: The USD Reversal
YTD Return (May): 28%
Position: Short USD
BlueCrest held a long-term bearish USD stance that paid off as the dollar fell 9%. The trade benefited from Moody’s US credit downgrade and Trump administration tariff announcements.
Source: HedgeWeek — BlueCrest Dollar Short (June 5, 2025)
Historical Performance Record
Sources:
2017: Platt’s $2B Payday
Forbes confirmed Michael Platt personally earned $2 billion in 2017 (Forbes estimate based on realized gains and allocable performance fees), when BlueCrest returned 54%. He ranked #1 on Forbes’ “Highest-Earning Hedge Fund Managers” list, tying with James Simons.
The structure: Platt owns the majority stake in the partnership and captures both management fees and a significant share of performance fees on the $3.9B+ capital base.
Sources:
Leverage Mechanics
UK court documents from 2022 revealed BlueCrest’s capital structure:
Partner Capital: $3.9 billion
Total Capital Allocations: $15 billion
Implied Trading Power Ratio: ~3.85x (calculated as $15B ÷ $3.9B, not a stated leverage metric in filings)
Court filings documented these figures separately; the ratio is arithmetic inference from their relationship. This structure explains how directional market moves are amplified: a 40% bond market move with ~4x trading power produces ~150%+ portfolio returns.
Sources:
Partner Economics (FY2025)
BlueCrest Capital Management (UK) LLP filed accounts showing:
Partnership Revenue: £130 million (+149% from £52M prior year)
Average Partner Profit Share: £959,000 (+93% from £498k)
Material Risk-Takers: 7 individuals averaging £4M each
BlueCrest pays portfolio managers approximately 30% of profits, above the 20% industry standard. This structure is designed to attract elite trading talent.
Sources:
Current Portfolio (13F Q3 2025)
BlueCrest’s SEC 13F filing disclosed ~$4.3 billion in US equity positions:
Top 5 Holdings:
Invesco QQQ Trust (QQQ)
SPDR Gold Shares (GLD)
iShares S&P 100 ETF (OEF)
NVIDIA (NVDA)
Microsoft (MSFT)
Critical Limitation: The 13F represents only US long equity and options positions. BlueCrest’s core fixed income, FX, and derivatives strategies (which generated the 153% and 95% returns) do not appear in these filings.
Sources:
Platt’s Wealth Trajectory
2024: $18.0 billion (Forbes #107)
2025: $18.8 billion (Forbes #106)
1-Year Growth: +$800 million
Source: Forbes Real-Time Billionaires
The COVID Trade (2020)
Return: 95%
Action: Reduced risk by ~$1 billion in March 2020
BlueCrest captured volatility spikes while de-risking into the crash. The firm cut its relative-value trading book significantly during the March sell-off, then positioned for the recovery. This is a hallmark of discretionary macro that systematic strategies struggle to replicate.
Sources:
What Remains Unknown
Strategy-level P&L attribution
Individual pod performance metrics
Exact swap/futures notional exposures
Real-time AUM beyond 13F disclosures
Daily risk metrics and VaR limits
BlueCrest operates under no disclosure obligations to external investors. Performance figures come from media reports, court documents, and regulatory filings (not audited financial statements).
Sources
All claims verified against primary sources as of January 2026:
Performance Data:
Founder Wealth & Earnings: 5. Bloomberg Billionaires Index — Michael Platt 6. Forbes — Michael Platt Profile 7. Forbes — 2017 Highest-Earning Hedge Fund Managers (Apr 17, 2018)
Compensation & Structure: 8. HedgeWeek — BlueCrest Partner Pay Surge (Oct 28, 2025) 9. eFinancialCareers — BlueCrest London Pay
Portfolio Holdings: 10. SEC EDGAR — BlueCrest 13F Filings 11. Whalewisdom — BlueCrest Holdings 12. Fintel — BlueCrest Portfolio
General Reference: 13. Wikipedia — BlueCrest Capital Management 14. Wikipedia — Michael Platt
Methodology Note: Performance figures are based on media reports citing BlueCrest sources and court documents. As a private family office, BlueCrest does not publish audited financial statements. Profit calculations (e.g., the ~$6B figure for 2022) are arithmetic estimates based on reported capital and returns, not disclosed audited figures. The 13F filings represent only US long equity/options positions and exclude the firm’s primary fixed income, FX, and derivatives strategies. Forbes earnings estimates are based on their proprietary methodology using realized gains and allocable performance fees.
📊 Support this research: https://www.patreon.com/c/NavnoorBawa
Cover: the SEC's order against BlueCrest Capital Management, 8 December 2020 (Release 33-10896), a public record.
You forgot to lead into it with Platt's poor results from 2014-2016.
This looks written by AI