


By September 21, the fund was liquidating.
Total damage: approximately $6 billion — 45% of assets under management.[²][³] Some academic sources document the loss at $4.35 billion from $9.668 billion total AUM, depending on whether you count the main fund or all Amaranth entities.[²]
This wasn’t a black swan. It was leverage, concentration, and a trader who believed he could control markets he didn’t fully understand.
The P&L Anatomy: How $6B Evaporated
Position Structure (Early September 2006):
80,000+ natural gas futures contracts concentrated in January 2007 delivery[⁴]
Controlled 46–81% of open interest in specific contract months[²][⁴]
Massive long March / short April calendar spread (betting March-April price differential would widen)
Leverage ratio: 5.54:1[²] (not the 8:1 often misreported)
The Thesis: Natural gas prices spike in winter (heating demand) and summer (air conditioning). The March-April spread should widen as winter storage depletes and spring refilling hasn’t begun. Historical volatility supported this — until it didn’t.
What Went Wrong:
The spread collapsed. The March-April 2007 spread fell from approximately $2.49 per MMBtu at the end of August to $0.58 by the end of September — a compression of roughly 77%.[¹][²]
Why? Market structure shifted:
Mild weather forecasts reduced winter heating demand expectations
Storage levels exceeded five-year averages by 7–11%[⁴]
Liquidity disappeared — when Amaranth needed to exit, counterparties knew and widened bid-ask spreads
Regulatory scrutiny (NYMEX raised margin requirements on August 9)[⁴]
The losses compounded:
September 14: $560 million single-day loss[¹][²]
September 15: Additional catastrophic losses
September 18–20: Forced liquidation into illiquid markets
The Liquidation:
September 20: Amaranth notified investors and sold the energy portfolio to JPMorgan Chase and Citadel for an estimated 50 cents on the dollar.[¹][²][³]
September 21: Markets stabilized.[²]
The Brian Hunter Factor: When Compensation Drives Concentration
Brian Hunter made $75–100 million in 2005 trading energy for Amaranth.[³][⁵][⁶][⁷]
Let that sink in. One trader. One year. $100 million.[⁵]
After that performance, Hunter negotiated his profit share from 7.5% to 15%.[³] Amaranth couldn’t say no — he was generating 80% of the fund’s returns.
But Hunter’s strategy had a fatal flaw: it required massive, concentrated positions to generate those returns. As positions grew, so did the risk — and Amaranth’s risk management couldn’t (or wouldn’t) stop him.
The Concentration Problem:
By September 2006:
Energy positions represented 80%+ of Amaranth’s portfolio risk
Natural gas futures dominated energy exposure
Positions were so large that unwinding them moved markets
This isn’t hedging. This is speculation at scale.
The Counterfactual: How John Arnold’s Centaurus Did It Right
While Amaranth imploded, John Arnold’s Centaurus Energy posted 300%+ returns in 2006.[⁸][¹⁴][¹⁵]
Arnold made $1 billion in natural gas profits that year.[¹²][¹⁶] Over Centaurus’s first seven years, it never returned less than 50% annually.[⁸]
What was different?
John Arnold’s Track Record:
Arnold made his name at Enron, generating $750 million profit in 2001 — one of the few bright spots in Enron’s collapse.[⁸][⁹][¹⁰][¹¹] He founded Centaurus in 2002 with $8 million.[¹²][¹³]
Centaurus vs. Amaranth:
Dimension Amaranth Centaurus Strategy Massive directional bets on calendar spreads Fundamentals-driven, market structure arbitrage Position Sizing 46–81% of open interest in key contracts Avoided market-moving concentration Risk Management Trader autonomy, minimal oversight Disciplined position limits, diversification Market Knowledge Calendar spreads, momentum Physical fundamentals, storage, transportation Liquidity Assumed liquidity would persist Priced liquidity risk into positions
The weekend Amaranth collapsed, Arnold reportedly declined to buy the positions — even at distressed prices.[¹²] He understood the fundamental value wasn’t there.
The Lesson:
Arnold’s success came from understanding natural gas as a physical commodity, not just a financial instrument. He knew storage constraints, pipeline flows, weather patterns, and how those translated into price dynamics.
Hunter traded derivatives based on historical volatility patterns without sufficient regard for changing fundamentals.
The Regulatory Aftermath: A 97.5% Settlement Discount
July 25, 2007: CFTC filed charges against Amaranth, alleging attempted manipulation of natural gas futures prices.[¹⁷][¹⁸]
July 26, 2007: FERC issued an order (one day after CFTC) alleging market manipulation.[¹⁹][²⁰]
The Allegations:
Amaranth held outsized positions to influence settlement prices
Trading patterns showed attempts to move markets during critical settlement windows
Positions were not bona fide hedges of physical exposure
The Settlements:
August 12, 2009: Amaranth settled with CFTC for $7.5 million[²¹][²²][²³]
April 2011: FERC administrative judge ruled against Hunter, imposing a $30 million fine[¹⁹][²⁴][²⁵]
March 15, 2013: DC Circuit Court overturned FERC’s ruling[²⁴][²⁶]
September 15, 2014: Hunter settled with CFTC for $750,000[²³][²⁴][²⁷]
The Math:
$30 million FERC fine → $750,000 CFTC settlement = 97.5% reduction
The Takeaway:
The legal ambiguity around what constitutes “manipulation” in commodity futures markets remains unresolved. FERC argued Hunter manipulated physical settlement prices. Courts said FERC overstepped its jurisdiction.
But regardless of legal outcomes, the market imposed its own penalty: $6 billion in losses.
Five Quantitative Lessons
1. Position Concentration Is Fragility
Controlling 46–81% of open interest in a contract isn’t a position — it’s systemic risk. When you need to exit, you are the market.
Quantitative Check: If your position represents >10% of daily volume, you don’t have a liquid exit.
2. Leverage Amplifies Everything
5.54:1 leverage seems modest compared to LTCM’s 25:1. But on a $9.2 billion portfolio, a 10% drawdown becomes a $5 billion loss with that leverage.
Quantitative Check: Calculate max drawdown at current leverage. If it exceeds 20% of AUM, reduce leverage or positions.
3. Historical Volatility ≠ Future Risk
Amaranth’s risk models relied on historical spread behavior. When fundamentals changed (mild winter forecasts, high storage), those models became worthless.
Quantitative Check: Stress test positions against regime changes, not just historical VaR.
4. Liquidity Is a Spectrum
Natural gas futures are “liquid” until you try to sell 80,000 contracts. Then they’re not.
Quantitative Check: Model exit time for full position unwinding. If it exceeds your margin call timeline, you’re underwater before you can act.
5. Asymmetric Compensation Drives Asymmetric Risk
Hunter’s 15% profit share on gains, but no proportional loss sharing, created moral hazard. He was paid to take massive risks with other people’s money.
Quantitative Check: Compensation structures should penalize risk-adjusted underperformance, not just reward absolute returns.
The Uncomfortable Question
Could Amaranth have survived with better risk management?
Probably not.
The positions were too large, too concentrated, and too dependent on a specific market structure that shifted. Once that March-April spread started compressing, there was no graceful exit.
The fundamental error wasn’t risk management — it was position sizing.
By the time risk management would have flagged the problem, it was already too late. The positions couldn’t be unwound without destroying their own value.
The real lesson: Don’t build positions you can’t exit.
Coda: Where Are They Now?
Brian Hunter: After settling with the CFTC for $750,000 in 2014, Hunter, who is Canadian and previously worked from Amaranth’s Calgary office, maintained a low public profile. He had previously attempted to launch Solengo Capital Partners in 2007 and worked as an adviser to Peak Ridge Capital Group’s Commodity Volatility Fund.[²⁴]
John Arnold: Retired from trading in 2012, now focuses on philanthropy. Centaurus Energy’s cumulative returns remain a benchmark for fundamental commodity trading.[⁸][¹²]
Amaranth Advisors: Liquidated. Dead.
Further Reading
Academic Sources:
Chincarini, L. (2007). “A Case Study on Risk Management: Lessons from the Collapse of Amaranth Advisors L.L.C.” Journal of Alternative Investments[²]
Till, H. (2006). “EDHEC Comments on the Amaranth Case: Early Lessons from the Debacle.”[⁴]
Regulatory Documents:
CFTC vs. Amaranth Advisors (2007–2014)[¹⁷][¹⁸][²¹][²³]
FERC vs. Brian Hunter (2007–2013)[¹⁹][²⁰][²⁴]
U.S. Senate Permanent Subcommittee Investigation (2007)[⁴]
Contemporaneous Reporting:
“Hedge Fund Had Exposure Equivalent to 10% of U.S. Demand,” Risk Magazine, October 2006[¹]
References
[¹]: “Hedge Fund Had Exposure Equivalent to 10% of U.S. Demand,” Risk Magazine, October 2006. Source
[²]: Chincarini, L. (2007). “A Case Study on Risk Management: Lessons from the Collapse of Amaranth Advisors L.L.C.” Journal of Alternative Investments. Source
[³]: “Combustion of a Hedge Fund: Amaranth Advisors,” Tontine Coffee House, August 2025. Source
[⁴]: Till, H. (2006). “EDHEC Comments on the Amaranth Case: Early Lessons from the Debacle.” Source
[⁵]: “Amaranth’s Brian Hunter Settles with U.S. CFTC,” Reuters, September 15, 2014. Source
[⁶]: Marks, H. (2006). “Pigweed,” Oaktree Capital Memo, December 7, 2006. Source
[⁷]: FERC Docket No. IN07–26–000, Initial Decision (2011). Source
[⁸]: “The Man Who Wants to Unmake the Future,” Wired, January 2017. Source
[⁹]: “John Arnold’s Shady Past,” The Real Arnolds, November 2023. Source
[¹⁰]: “John D. Arnold,” Wikipedia. Source
[¹¹]: “Enron Trader Had a Year to Boast Of,” New York Times, July 9, 2002. Source
[¹²]: “John Arnold Shuts His Centaurus Energy Fund,” Capital Mind, May 2012. Source
[¹³]: “John Arnold: The Natural Gas Guru,” Next Finance, March 2011. Source
[¹⁴]: “Natgas Trading Legend Arnold Retires, Ending Era,” Reuters, January 2012. Source
[¹⁵]: “Energy Fund Reports 317 Percent Return,” Reuters, January 2011. Source
[¹⁶]: “The Story of Centaurus Hedge Fund: Rise and Fall of a Trading Giant,” Shipping and Commodity Academy. Source
[¹⁷]: CFTC Press Release 5359–07, July 25, 2007. Source
[¹⁸]: CFTC Press Release 5502–08, March 27, 2008. Source
[¹⁹]: “Energy Futures, Ex Post,” Global Markets Law Journal, 2010. Source
[²⁰]: FERC Order 120 FERC ¶ 61,085 (July 26, 2007). Source
[²¹]: CFTC Press Release 5692–09, August 12, 2009. Source
[²²]: “Amaranth Settles with CFTC,” DealBook, August 12, 2009. Source
[²³]: CFTC Press Release 7000–14, September 15, 2014. Source
[²⁴]: “Brian Hunter Settles Natural Gas Trade Manipulation Case with CFTC,” Troutman Pepper Energy Report, September 2014. Source
[²⁵]: “Energy Futures, Ex Post,” The Reg Review, April 11, 2013. Source
[²⁶]: Hunter v. FERC, 711 F.3d 155 (D.C. Cir. 2013). Source
[²⁷]: “Ex-Amaranth Trader Reaches $750,000 Settlement with CFTC,” Bloomberg, September 15, 2014. Source
Follow for more deep-dives into hedge fund disasters, trading strategies, and quantitative risk management.
About This Series:
I’m building public depth in quantitative finance concepts by deconstructing real trades executed by hedge funds. Every article asks: How did this trade make (or lose) money — and what can we learn from it?
Feedback welcome. Citations verified against primary sources.
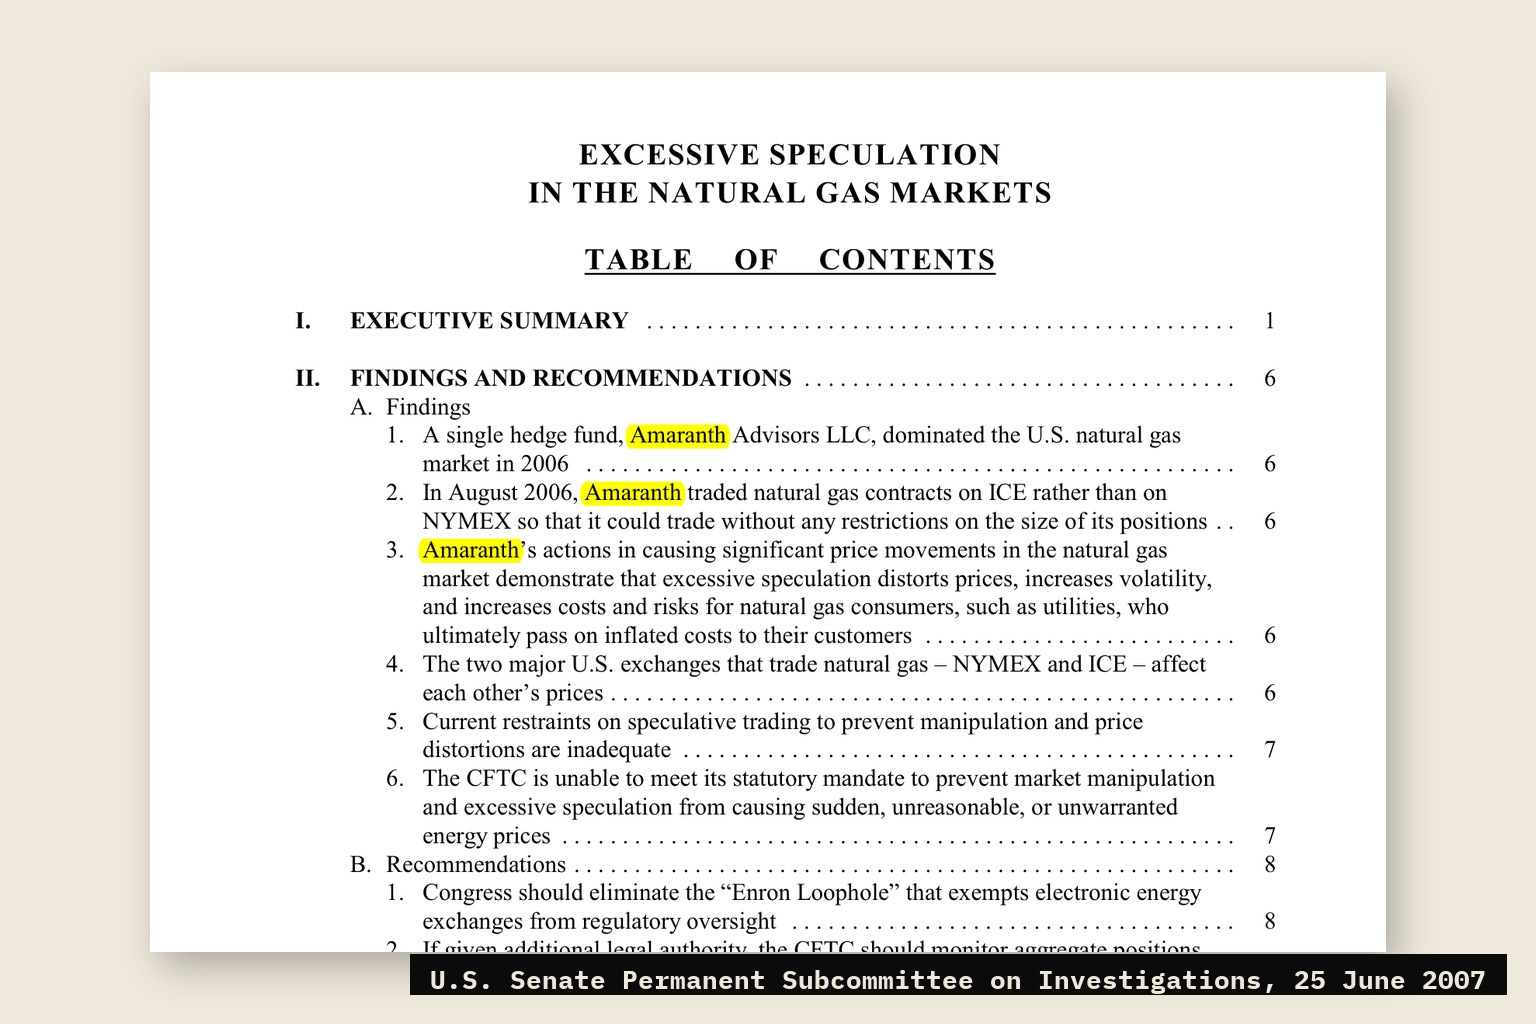
Cover: "Excessive Speculation in the Natural Gas Market", U.S. Senate Permanent Subcommittee on Investigations, 25 June 2007, a public record.