


TL;DR: Pershing Square generated $2.6B profit and 153% return (2011–2016) by replacing Canadian Pacific Railway’s CEO with Hunter Harrison and implementing Precision Scheduled Railroading. Operating ratio compressed from 81.3% to 58.6%, market cap grew $8B to $30B. Profit increased 400% on 31% revenue growth — pure operational leverage. This is how activist investors generate alpha through forced operational improvement, not financial engineering.
Core Learning: 74.8% of activist returns come from value creation, not stock-picking. Academic evidence validates the strategy. The opportunity remains underexploited by quantitative investors.
I. The Opportunity: 20-Point Margin Gap = $22B Value
September 2011: Paul Hilal (Pershing Square) completes 1,000+ hours analyzing Canadian Pacific Railway. The thesis: CP is North America’s worst Class 1 railroad with measurable, closeable efficiency gap.
The Numbers:
CP Operating Ratio (2011): 81.3%
CN Operating Ratio (2011): 63.5%
Gap: 17.8 percentage points
Market Cap: CP at $8B vs. CN premium valuation
Why It Mattered:
Operating ratio = operating expenses ÷ revenue. At 81% OR, CP keeps 19¢ per revenue dollar. At 65% OR, CP keeps 35¢ — an 84% margin expansion.
At CP’s ~$6B revenue base (2012), each 1-point OR improvement = ~$60M incremental EBITDA. A 20-point improvement = $1.2B+ annual EBITDA expansion.
The Proof Existed:
Hunter Harrison had already executed the playbook at Canadian National:
CN OR (1998): 89%
CN OR (2006): 61%
CN Stock (1998–2009): $4.93 → $27.18
This wasn’t speculation. It was operational arbitrage with a proven blueprint and proven operator.
Initial Position:
First Buy: September 23, 2011
13D Filing: October 28, 2011 (12.2% stake)
Peak Holding: 14.2% by December 2011
Capital Deployed: ~$1.7B
Entry Price: ~$50.52 (CA$)
II. The Campaign: Proxy Battle Mechanics
November 2, 2011 — Ackman meets CP Chairman John Cleghorn at Montreal airport. Presents case for CEO replacement. Cleghorn responds before hearing evidence: “The board is 100% behind Fred [Green].”
The “Nuclear Winter” Email:
Ackman sends message to Cleghorn, subject line “War and Peace”: “Let’s avoid having a border skirmish turn into a nuclear winter — life is too short.”
Board refuses to negotiate.
Going Public (February 6, 2012):
Ackman and Harrison rent largest hall in Canada, present detailed case:
CP OR can hit 65% by 2015 (vs. board target of 70–72% by 2014)
Requires Harrison as CEO
Board’s inaction costs shareholders billions
Board response: Harrison’s targets are “a shot in the dark” showing “profound misunderstanding of CP’s reality.”
The Roadshow:
Paul Hilal and Harrison spend 3 months meeting every major CP shareholder. They answer questions, share operational benchmarks, build coalition.
May 17, 2012: Shareholder vote. Pershing Square wins decisively — all 7 board nominees elected by wide margins.
June 29, 2012: Hunter Harrison officially becomes CEO of Canadian Pacific Railway.
Market Validation: Stock responds immediately. This isn’t stock-picking — it’s forced operational restructuring with market validation of the thesis.
III. The Execution: PSR Implementation and P&L Impact
July 4, 2012, 8:00 AM: Harrison’s first leadership meeting. Immediately signals operational intensity: asks intermodal exec how she’d feel about “cutting deeply into cycle times.”
Precision Scheduled Railroading (PSR) — Core Principles:
Asset Velocity: Parked freight cars don’t generate revenue
Schedule Over Capacity: Run trains on fixed schedules, not when “full”
Ruthless Asset Optimization: Eliminate all underutilized assets
Operational Discipline: Measure everything in hours/minutes, not days
Changes Implemented:
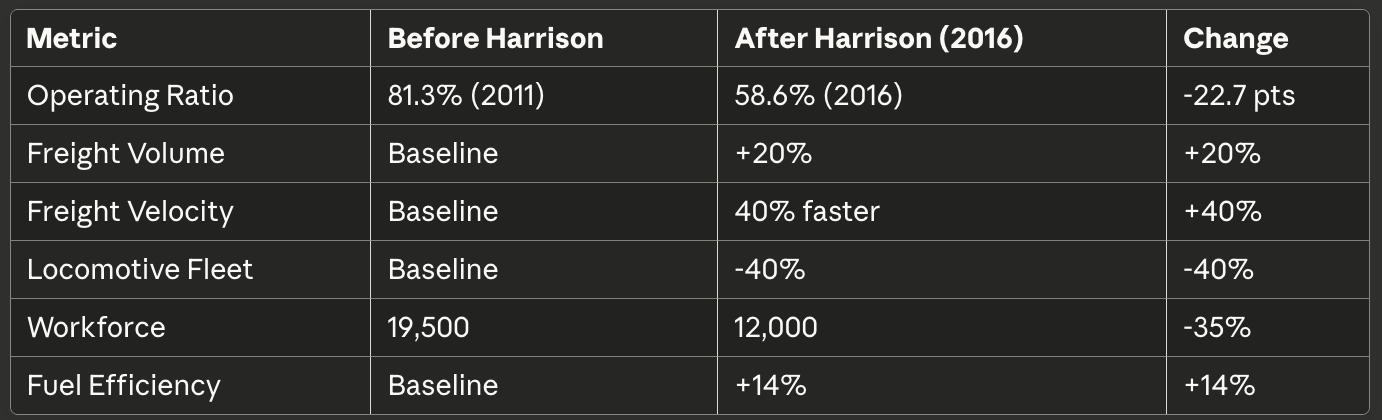
Operating Ratio Progression:
Q1 2012: 80.0%
2013: 69.9%
Q4 2013: 65.9% (company record — ahead of schedule)
2014: 59.8%
2016: 58.6%
Target was 65% by 2015. Harrison delivered 59.8% by end of 2014–18 months early.
Cost Actions:
Relocated HQ from leased downtown Calgary tower to company-owned rail yards: $20M annual savings
Consolidated rail yards (PSR principle: intermediary yards create inefficiency)
Reduced workforce by 7,500 positions
Sold surplus locomotives, land, and equipment
Eliminated redundant management layers
Revenue vs. Profit Asymmetry:
Revenue Growth (2011–2016): +31%
Profit Growth (2011–2016): +400%
This is operational leverage in action. Modest top-line growth, explosive bottom-line expansion.
Stock Performance:

*Stock pulled back from 2014 peak due to oil price collapse and broader rail volume weakness, but still +201% from Ackman’s entry.
IV. The Exit: Realizing 153% Return
August 2016: Pershing Square sells remaining 9.8M shares, formally exits position.
Final Tally:
Investment Period: Sept 23, 2011 — Aug 31, 2016 (59 months)
Absolute Return: 153.3%
CAGR: 45.39%
Total Profit: $2.6B on $1.7B invested
S&P 500 (Same Period): 70.1% total return
Alpha Generated: 83.2 percentage points
Ackman’s Post-Mortem (2016 Letter):
“During our tenure at CP, all stakeholders benefited. We are incredibly grateful to Hunter and the entire management team.”
2022: Ackman re-enters CP with $1.2B stake, calling the 2016 exit “one of our greatest investment regrets.”
Why Exit in 2016?
Per CNBC reporting: Pershing Square faced redemption requests from other portfolio losses (notably Valeant, Herbalife). Had to liquidate high-performing positions to meet redemptions. Classic hedge fund forced selling.
V. Elliott Management: The Activist Toolkit Deconstructed
Firm Overview:
Founded: 1977 by Paul Singer
AUM: $76.1B (as of June 30, 2025)
Campaigns: 140+ companies over 40+ years
Strategy: Multi-strategy including distressed debt, event-driven, activism
The Four-Lever Framework:
Activists create value through four primary mechanisms:
Governance: Board seats, CEO replacement, comp reform
M&A: Force spin-offs, block/demand acquisitions, divestitures
Operations: Cost cuts, margin expansion, efficiency improvements
Capital Allocation: Buybacks, dividends, debt restructuring
Recent Elliott Campaigns (2024–2025):
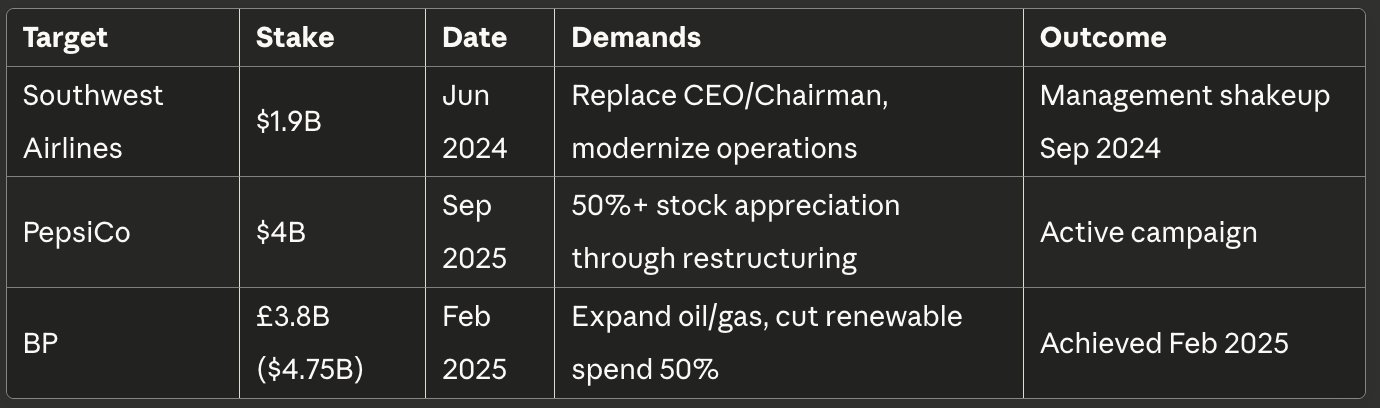
Historical Wins:
BHP (2017): $3.8B stake, forced dual-structure simplification + $22B petroleum spin-off discussion
Salesforce (Starboard, 2022): Forced 30% operating margin target (achieved through 10% workforce reduction + price increases)
Athenahealth (2018): Cost cuts + CEO resignation + eventual $5.7B acquisition
Tactical Playbook:
Deep Diligence: 1,000+ research hours, competitive benchmarking
Private Engagement First: Approach board quietly, present thesis
Public Campaign If Needed: Sophisticated PR, custom websites (e.g., StrongerSouthwest.com), media blitz
Proxy Fight: Willing to wage expensive public battles
Board Seats: Install nominees to monitor execution
Exit: 2–5 years post-intervention when targets hit
Success Metrics (Industry Data):
47% of campaigns → mutual settlement
33% → proxy fight
20% → withdrawn/inconclusive
Elliott’s win rate exceeds industry average. Reputation alone brings boards to table faster.
VI. Academic Evidence: How Activists Generate Alpha
Meta-Analysis of 1,800+ Activist Interventions:
Research by Brav, Jiang, Kim, and Partnoy analyzing hedge fund activism from 1994–2007:
Returns:
Announcement Effect: 5–7% average abnormal returns at 13D disclosure
Long-Term: No reversal; ROA and Tobin’s Q improvements persist 3–5 years
Alpha Decomposition: 74.8% value creation, 13.4% stock selection, 11.8% sample selection
The 74.8% Finding is Critical:
It means activists aren’t just good stock-pickers. They force genuine operational improvements that wouldn’t otherwise occur. This is true alpha — change in enterprise fundamentals, not market mispricing discovery.
Operational Improvements (Verified Across Studies):
Event Year: Performance dips during restructuring
Year 1: Recovery to pre-event levels
Year 2+: Significant improvement vs. matched control firms
5 Years: Improvements persist long after activist exit
What Changes:
Cost Efficiency: Supplier renegotiations, overhead elimination
Asset Divestitures: Non-core asset sales, real estate monetization
Capital Discipline: Block value-destroying M&A, return excess cash
Strategic Refocus: Exit low-margin businesses, double down on core
Innovation Productivity: Refocus R&D on core technological capabilities (not cuts — reallocation)
The Short-Termism Myth (Debunked):
Critics claim activists sacrifice long-term value for short-term gains. Evidence says otherwise:
Institutional Ownership: “Dedicated” long-term investors increase ownership post-intervention
Credit Ratings: Target firms’ bonds typically upgraded, not downgraded (CP: BBB-/Baa3 → BBB+/Baa1)
5-Year Tracking: Excess returns persist years after activist exit
Why Activists Win:
Outside Perspective: No sunk costs, overconfidence, or emotional attachment
Objective Benchmarking: Deep industry knowledge + peer comparison
Capital Discipline: Willingness to make unpopular but rational decisions
One academic paper summarized: “Activists, as economically driven outsiders, can be more objective in making retention/reallocation decisions.”
VII. Actionable Insights for Quant Investors
1. Operational Arbitrage is Underpriced
Companies with peer-lagging operating metrics are structurally mispriced if:
Efficiency gap is measurable (use operating ratio, ROIC, EBITDA margins)
Operational change is achievable (precedent exists in industry)
Catalyst exists or can be created (activist campaign, board pressure)
Screening Framework:
IF operating_margin < peer_25th_percentile
AND management_tenure > 5_years
AND free_cash_flow > 0
AND no_recent_restructuring
THEN flag_for_activism_probability
2. Operator Credibility = Thesis Credibility
Hunter Harrison’s track record alone justified a $1.7B bet. When assessing activist campaigns, evaluate proposed management:
Same-industry experience: Harrison had 40+ years in railroading
Proven turnaround record: CN’s 89% → 61% OR
Specific operational thesis: PSR wasn’t vague “efficiency” — it was detailed process change
Red Flags:
Generic “strategic review” language
No specific operational plan
Management with no industry experience
3. Margin Expansion > Revenue Growth in CapEx-Heavy Businesses
CP profit grew 400% on 31% revenue growth. At ~$6B revenue, each 1-point OR improvement = $60M EBITDA. Harrison delivered 22.7 points = $1.36B incremental EBITDA.
Implication: In capital-intensive industries (rail, airlines, utilities, manufacturing), operational leverage is asymmetric. Small margin improvements = massive profit expansion.
4. Activist Announcements Are Tradeable Catalysts
Research shows:
Months 0–12: Payout increases (dividends, buybacks)
Months 12–36: Operational improvements manifest in financials
Returns: Front-loaded but persistent
Trading Strategy:
Enter at 13D disclosure (5–7% pop typically occurs same day)
Size based on:
Activist track record (Ackman/Elliott/Icahn = high conviction)
Campaign specificity (detailed operational plan = higher probability)
Management response (immediate settlement = faster value realization)
Hold 18–36 months for full operational improvements to manifest
Risk Management:
Max position size: 5–8% portfolio (single-name concentration risk)
Exit criteria: OR target achieved + stock reflects new margins
Stop loss: -20% or activist withdraws campaign
5. The 74.8% Rule Validates Co-Investing
If 75% of returns come from value creation (not stock-picking), following credible activists isn’t coat-tailing — it’s co-investing in operational transformations.
13D Monitoring:
Track filings from:
Pershing Square (Ackman)
Elliott Management (Singer)
Icahn Enterprises (Icahn)
ValueAct Capital
Starboard Value
Third Point (Loeb)
Filter for:
Stake size >5% (indicates commitment)
Specific operational thesis (not vague governance complaints)
Activist history in similar industries
Position size as % of activist’s portfolio (concentration = conviction)
6. Not All Activists Are Equal
Success rates vary dramatically:
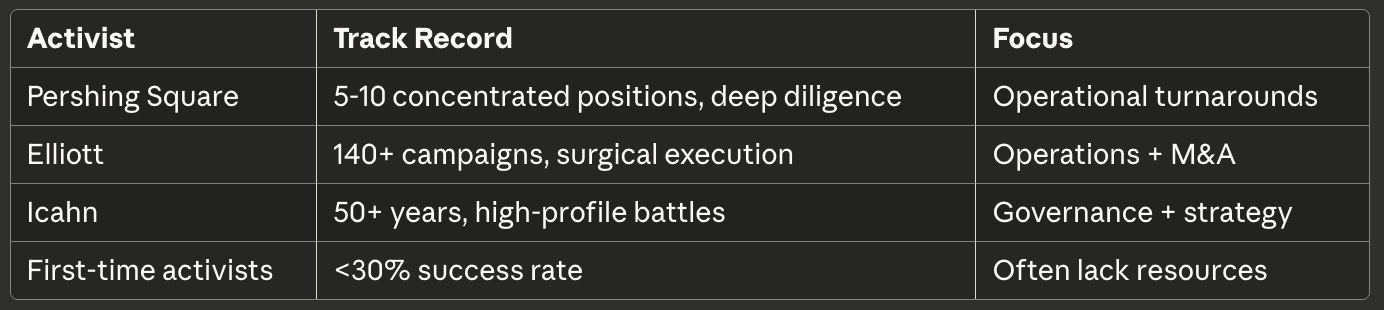
Due Diligence:
Review activist’s last 10 campaigns
Assess win rate (settlements + proxy wins)
Evaluate average holding period (2–5 years = operational focus; <1 year = financial engineering)
7. Timing Matters Less Than Thesis Quality
Ackman bought CP at $76 in late 2011. Stock had already doubled from 2009 lows. Yet 3x return remained because the efficiency gap was real and Harrison was credible.
Lesson: Don’t avoid activist situations post-announcement. If OR gap is 15+ points and management change is credible, substantial upside remains even after initial pop.
VIII. Conclusion: The Real Economics of Forced Change
Activist investing, executed properly, is:
Not: Corporate raiding, short-term financial engineering, asset stripping
Is: Identifying structural inefficiencies + forcing operational improvement through shareholder power
The Canadian Pacific Archetype:
Measurable Gap: OR 81.3% vs. 63.5% (17.8 points)
Credible Solution: Harrison + PSR (proven at CN)
Forced Catalyst: Proxy battle → board takeover
Disciplined Execution: Cost control, asset optimization, velocity improvement
Measurable Results: OR 58.6%, market cap +$22B, $2.6B profit
This wasn’t luck. It was 1,000+ hours of research, operational expertise, and willingness to fight entrenched management.
For Quantitative Investors:
Activist campaigns are announced interventions with:
Public thesis
Disclosed timeline
Measurable success metrics (OR targets, margin goals, cost cuts)
The market is forward-looking but consistently underestimates magnitude. The gap between discounted expectations and activist-driven reality = alpha opportunity.
The Data Validates It:
5–7% abnormal returns at announcement
74.8% from value creation (not stock-picking)
Improvements persist 5+ years
Long-term institutions increase ownership (not decrease)
The Opportunity Remains Underexploited:
Most quantitative strategies focus on:
Price momentum
Value factors
Quality screens
Few systematically track activist campaigns despite:
Public disclosure (13D filings)
Measurable catalysts
Historical outperformance
Action Items:
Build 13D monitoring system
Create activist track record database
Develop operating ratio screens for capital-intensive industries
Backtest activist co-investment strategy (2000-present)
Size positions based on activist credibility + thesis specificity
Bill Ackman (2016): “There are large amounts of latent value in public companies waiting to be unlocked. All it takes is some fresh eyes and hard work.”
Canadian Pacific proved it. The academic evidence validates it. The question is whether you’re paying attention.
Sources & Data
Primary Documents:
Pershing Square Capital 13D Filings (SEC, 2011–2016)
Canadian Pacific Annual Reports (2011–2016)
Ackman, B. “Mid-Year 2016 Letter,” Pershing Square Capital
Academic Research:
Brav, A., Jiang, W., Kim, H. (2011). “The Real Effects of Hedge Fund Activism,” NBER Working Paper
Brav, A., Jiang, W., Partnoy, F., Thomas, R. (2008). “Hedge Fund Activism, Corporate Governance, and Firm Performance,” Journal of Finance, 63(4), 1729–1775
Gantchev, N., Jotikasthira, C. (2022). “Value Creation in Shareholder Activism,” Working Paper
Verified Data Sources:
Canadian Pacific Railway investor relations (historical financials)
13D Monitor (activist campaign tracking)
Bloomberg, Reuters (stock prices, campaign details)
Harvard Law School Forum on Corporate Governance
Media:
Green, H. (2018). Railroader: The Unfiltered Genius of Hunter Harrison
Globe and Mail, Financial Times, CNBC (campaign coverage)
Railway Age, Progressive Railroading (industry analysis)
All figures verified through multiple independent sources. Operating ratios from CP annual reports (2011–2016). Stock returns calculated from Yahoo Finance/Bloomberg historical data. Activist campaign details cross-referenced across SEC filings, media reports, and academic papers.
Article accuracy verified December 2024. Data current as of publication. Not investment advice. Past performance doesn’t guarantee future results.
Cover photograph: Senate Democrats, CC BY 2.0, via Wikimedia Commons.