


From Andurand’s confirmed €30→€85 EUA call — generating 87% fund returns in 2021 — to Citadel, Millennium, and Point72 running dedicated EU carbon emissions desks today: EU carbon allowances are now a fully institutionalized macro trade. This is the complete strategy anatomy — and why one sentence from Friedrich Merz erased 25% of a record crowded long in 48 hours.
The Trade That Opened the Institutional Playbook
On August 2, 2021, Evolution Markets facilitated the first-ever block trade in CME Group’s CBL Nature-Based Global Emissions Offset (N-GEO) futures — 200 contracts at $5.40/offset, with Hartree Partners and Andurand Climate and Energy Transition Fund as counterparties. It was a footnote. The real story was what Andurand was building simultaneously in the EU Emissions Trading System.
By year-end 2021, carbon emissions were among the biggest winners in Andurand’s portfolio, with the fund capturing most of the move from €30 to €85 per EUA. His flagship Andurand Commodities Discretionary Enhanced Fund returned 87% in 2021. The dedicated Climate and Energy Transition Fund — launched July 2021 — returned 28% by January 2022 and won “New Macro Fund of the Year” at EuroHedge 2022. That performance compressed what had been a niche compliance market into a fully tradeable macro thesis. The institutional colonization that followed was rapid and systematic.
Bloomberg reporting confirmed that Citadel, Millennium, and Point72 now operate dedicated emissions pods. Systematica Investments added carbon futures to its flagship BlueTrend CTA. Why these firms — some of the most rigorous allocators of capital on earth — converged on EU carbon allowances as a liquid macro opportunity requires understanding the market’s structural mechanics before the strategies themselves become legible.
EU ETS Market Structure: Why Carbon Is Institutionally Tradeable
The EU Emissions Trading System operates on cap-and-trade mechanics with one defining feature: supply is set by democratic legislation and cannot respond to price. The EU issues a fixed annual supply of EU Allowances (EUAs) — each representing the right to emit one tonne of CO₂ — and reduces that supply via the Linear Reduction Factor — currently 4.3% per year, tightening further to 4.4% from 2028. In oil, a price spike triggers incremental supply. In EUAs, it triggers nothing. The asymmetry is the trade.
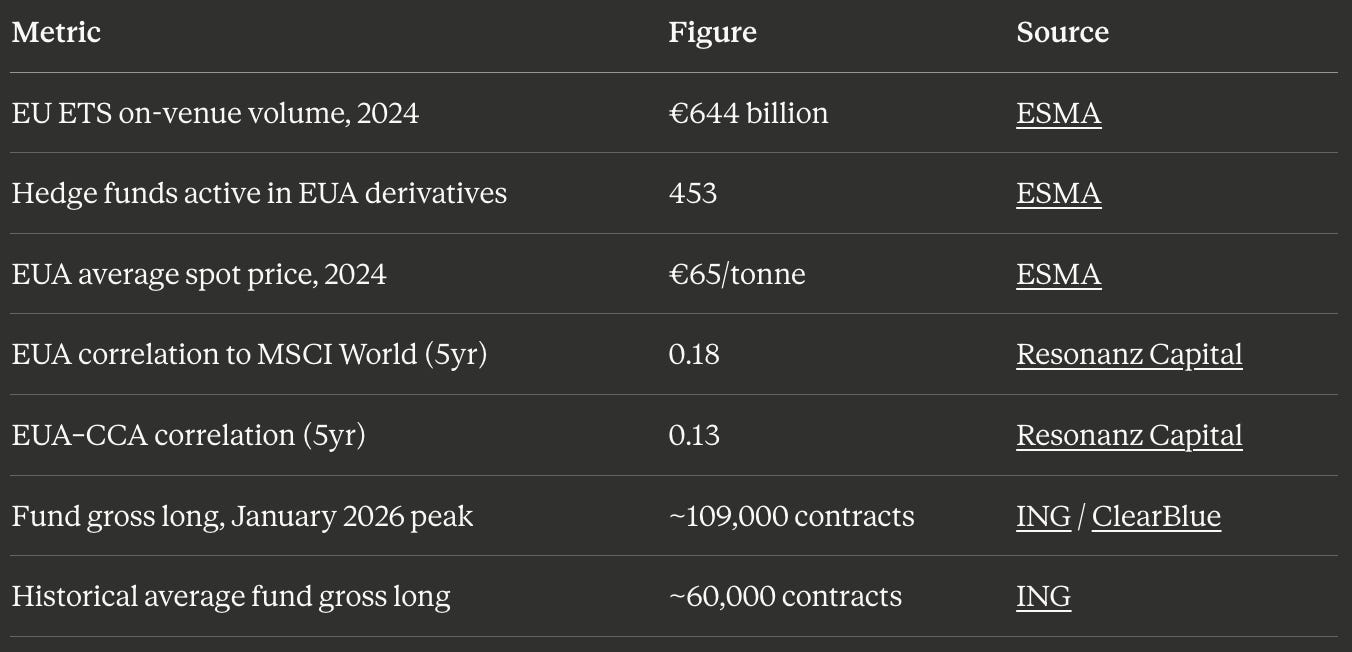
The EU ETS secondary market is the world’s largest carbon market. In 2024, ESMA’s Carbon Markets Report recorded approximately €644 billion in on-venue monetary turnover across roughly 4.7 million total transactions, with the EUA spot price averaging €65/tonne for the year. That same year, 599 million EUAs were auctioned, generating approximately €39 billion for EU member states. All auctions were oversubscribed.
ESMA’s participant breakdown is the structural foundation of every fund strategy described below. Non-financial firms hold long positions for compliance; banks and investment firms hold short positions, supplying allowances to compliance buyers. Banks and investment firms held 51% of all EUA derivative positions in 2024, up 10 percentage points from 2023. Investment funds — hedge funds — represent a smaller but disproportionately influential slice: 453 funds active in EUA derivatives, holding approximately 6% of all positions. Small enough to build quietly. Large enough to move prices by 25% when they all exit simultaneously — as February 2026 demonstrated.
-ESMA
-ESMA
-ESMA
-ING
On the California side, ICE reported a record 3.9 million CCA futures and options traded in 2024 — more than four times the 2018 volume — with ICE’s total environmental complex clearing over $1 trillion globally. Managed money accounts make up approximately one-quarter of open interest in CCA futures, per CFTC positioning data. With that structural foundation established, the four approaches hedge funds use to build alpha in EU carbon markets become legible.
Strategy 1: The Directional Long — Andurand’s EUA Thesis Anatomy
The Fit for 55 package of 2021 was the structural catalyst. Before it, the annual EU ETS cap reduction ran at 2.2%. The package accelerated this to 4.3% — nearly doubling the rate of structural supply reduction. On an inelastic supply curve, a near-doubling of the annual tightening rate is a clean directional signal.
Layered on top: the Market Stability Reserve. The MSR automatically withholds 24% of the Total Number of Allowances in Circulation (TNAC) from auction volumes each year when the TNAC exceeds the upper threshold of 833 million allowances. Crucially, the EU Commission publishes the TNAC every June 1 — meaning funds that model it correctly know, months in advance, exactly how much EUA supply will be absorbed in the subsequent 12-month period. In the 2025–2026 intake period, the EU Commission announced the MSR would remove approximately 276 million allowances from auction volumes between September 2025 and August 2026 — one of the sharpest supply-side contractions in the EU ETS’s history. And in January 2024, 382 million EUAs were permanently invalidated after the MSR exceeded its fixed threshold. Permanent, irreversible supply destruction.
Bloomberg reported in February 2021 that Andurand was among hedge funds betting the price of carbon can only go up, forecasting it could triple from then-current levels. The vehicle was long EUA December futures on ICE Endex combined with California Carbon Allowances. EUAs moved from approximately €30 to €85 by December 2021. The Andurand Commodities Discretionary Enhanced Fund returned 87% that year, and 162% in the first half of 2022 — though by then energy and oil were major contributors as well.
The defining edge: EUA supply is set in legislation years in advance, announced via published regulatory calendars, and completely inelastic to price. No other liquid commodity gives a fundamental trader this degree of supply-side forecastability.
Strategy 2: Carbon Cap Management — Long Core Plus Active Alpha Across Five Markets
Michael Azlen’s Carbon Cap Management, founded in London in 2018, built the most institutionally transparent dedicated carbon fund structure available. The World Carbon Fund launched in March 2020 as a globally diversified fund investing across multiple liquid regulated carbon markets, split into two components: a long-biased Core Strategy running tactical allocations across EUAs, UKAs (UK Allowances), CCAs (California Carbon Allowances), RGGI, and New Zealand allowances combined with an options overlay, and Alpha Strategies generating returns from cross-market arbitrage, relative value, and seasonal patterns.
The fund’s execution is granular. In August 2024, as reported by Green.Earth when the fund crossed $500 million AUM, the Core Strategy gained +3.78% from overweight positions in UK and California markets while the Alpha Strategies added +0.49% from arbitrage and short-term trades. Annual returns compiled by Resonanz Capital: approximately +9% in 2022 (vs. -4.4% for the HFRX Global Hedge Fund Index), +14.9% in 2023, +6.2% in 2024, and cumulative returns exceeding 100% net since the 2020 launch.
The structural reason this works: over the five years to March 2025, EUA prices showed a correlation of only 0.18 to MSCI World, 0.25 to the Bloomberg Commodity Index, 0.30 to Brent crude, and just 0.13 to CCA prices. These are not merely low correlations — they reflect structural decoupling. EU carbon allowances respond to policy calendars, cap schedules, auction outcomes, and compliance deadlines, none of which are GDP prints or Fed minutes. The fund carries Article 9 SFDR status, with 20% of performance fees used to purchase and cancel compliance allowances — permanently reducing EU ETS supply while generating returns.
Strategy 3: Kepos Capital — The Quantitative Asset Pricing Framework
Kepos Capital’s approach to EUA and carbon allowance trading is intellectually distinct from the preceding strategies. The firm — managing approximately $2 billion — was co-founded by Mark Carhart, former co-CIO of Goldman Sachs’s Quantitative Investment Strategies Group, and Bob Litterman, who spent 23 years at Goldman Sachs across research, risk management, and investment roles — heading the firm-wide risk function from 1994 before leading the quantitative group in Asset Management — and subsequently chairing the CFTC’s climate-related market risk subcommittee.
Litterman’s thesis: the primary portfolio risk is not climate change per se, but asset repricing when markets are forced to internalize appropriate carbon incentives. As he stated publicly as early as 2014: “The risk that investors have in their portfolios is not climate risk, per se, it’s the risk that assets will be repriced because appropriate incentives are created globally to conserve on emissions.” He and Kent Daniel co-authored research in PNAS (2019) applying asset pricing theory directly to the carbon price, arguing for a high EUA price today that declines over time as the insurance value of mitigation falls. If current carbon prices are below their efficient level — which they are if the EU policy trajectory holds — the trade is long until policy closes the mispricing gap.
Hedgeweek confirmed that Kepos’s Carbon Evolution Fund trades California Carbon Allowances, RGGI derivatives, and EU Allowances. The SEC Reg D filing confirms the fund is operational and fundraising. The cross-market design — simultaneously long CCA, RGGI, and EUA — exploits pricing divergences between markets that share a unit of account (one tonne CO₂) but operate under radically different regulatory regimes, market structures, and compliance deadlines.
The Policy Calendar Edge: How Professional Carbon Traders Read Structural Signal
The three fund strategies above share a common execution layer: systematic monitoring of a policy calendar that generates forecastable, recurring price discontinuities. Research published in Energy Economics identified seven speculative bubbles in EUA futures between 2017 and 2022 — six of which aligned with major EU policy events. These are not market anomalies. They are the predictable consequence of EU ETS supply being set legislatively rather than by price response — the same structural feature that makes the directional long, the multi-market arbitrage, and the quantitative asset pricing approaches all viable.
The professional monitoring cadence runs on three recurring dates. Every June 1, the EU Commission publishes the TNAC — Total Number of Allowances in Circulation. This single number determines MSR absorption for the next 12 months. The decision rule is mechanical and public: if TNAC exceeds 833 million, 24% of the surplus is absorbed. Funds that model TNAC accurately know the coming supply shock months before it’s announced. Weekly, ICE publishes Commitment of Traders data breaking down EUA futures positions by participant type — the primary crowding signal, identifying when a structurally valid thesis has become dangerously consensual. And April 30 is the annual compliance deadline: firms must surrender EUAs matching their verified prior-year emissions or face €100/tonne fines. As this date approaches, structurally short compliance buyers become distressed, generating a seasonally predictable demand spike as forecastable as an options expiry.
These three dates, modeled together with the legislative calendar of EU ETS reviews and MSR announcements, create a repeating structure of identifiable entry and exit points that no other liquid commodity market provides — which is precisely why the January 2026 crowded long was so dangerous when the calendar delivered an unexpected political shock instead.
The January 2026 Crowded Long: Anatomy of a Forced Unwind
The January 2026 setup was fundamentally sound but structurally overcrowded. Three supply-side factors had compressed simultaneously into a compelling EUA long thesis. First, REPowerEU supply exhaustion: with EUA prices near €70/tonne, ING estimated that only 54.3 million further allowances needed to be auctioned to hit the €20 billion REPowerEU revenue target — meaning the additional supply program’s overhang would mechanically end. Second, CBAM structural demand: the Carbon Border Adjustment Mechanism fully engaged in 2026, creating net new hedging demand from non-EU importers of steel, cement, aluminum, and fertilizers. Third, the MSR’s removal of approximately 276 million allowances from the 2025–2026 auction window.
The combination was compelling enough that investment funds built a record net long — buying more than 100,000 lots between August 2025 and January 2026 — pushing the December EUA contract above €92/tonne in mid-January. The positioning was historically extreme: gross long contracts stood near 109,000, far above the 2018–2025 historical average of approximately 60,000 contracts. The structural thesis was intact. The crowding risk was not.
The trigger arrived on Wednesday, February 11, 2026 at the European Industry Summit in Antwerp — a gathering of European industrial chiefs with the EU’s top lawmakers. German Chancellor Friedrich Merz told the audience the EU should be open to revising or postponing the ETS if it fails to drive carbon-free production while harming competitiveness — and received loud applause from the assembled industry executives. EUA Dec-26 opened 6.5% lower the following morning, Thursday February 12, as the market digested the policy risk in full. The total decline from January’s peak reached 25%, with the December contract touching sub-€70 at points during the week. The fund gross long as a percentage of total open interest fell from nearly 23% in January to around 16% — still more than double the 2018–2025 average of roughly 7%, meaning further unwind risk remained.
The structural lesson: Crowding risk in EU carbon is amplified by the same policy-sensitivity that creates directional edge. A single political sentence reprices what took months of fundamental accumulation to build.
Despite the collapse, ING maintained its full-year 2026 average EUA forecast at €83/tonne — implying the fundamental supply tightening thesis remained intact and the repricing reflected political risk premium, not a structural breakdown. Funds that had shorted the crowded positioning — or purchased puts at the €92 peak — captured the entire 25% move in weeks. Funds that were long unhedged absorbed it.
Q3 2026 EU ETS Review: The Binary Event That Defines the Next 18 Months
The Q3 2026 EU ETS legislative review is now the single most important event on the carbon calendar before 2030 — and the one every fund with a carbon desk is actively modeling. The Commission is already signaling potential structural changes: a slower phase-out of free allowances from 2028, and a possible reduction in the Linear Reduction Factor from 4.3% to as low as 3.4% from 2029, per ING’s analysis. Either change would materially alter the long-run EUA supply trajectory and force a repricing of every forward-looking carbon model.
The political economy is genuinely contested. Climate Commissioner Hoekstra called it “intellectually lazy” to make the EU ETS the scapegoat for industrial struggles, defending the scheme as the market-based instrument Europe needs to meet its 2040 targets. Von der Leyen argued the problem is not the carbon price itself but how revenues are deployed — noting publicly that member states spend barely 5% of ETS proceeds on industrial decarbonisation, and that channelling more revenues back to industry would be central to the upcoming reform. But the coalition holding the current framework is fragile: Merz received loud applause at Antwerp when he called for revision.
Meanwhile, the global alternative — UN Article 6 carbon trading — is operational but implementation lags severely behind political agreements. The framework has genuine momentum: as of late 2025, over 90 bilateral Article 6.2 agreements had been established across more than 50 nations, and the IGES 2025 Implementation Status Report counts 99 formalized bilateral agreements or arrangements across 61 Parties. But as of April 2025, only one ITMO transfer had been fully completed — between Switzerland and Thailand in January 2024 — with domestic legal frameworks and registry infrastructure still being built in most signatory countries. Until Article 6 operationalizes at scale, the EU ETS remains, by approximately 90%, the dominant liquid carbon market globally — and the only one where institutional-grade derivatives infrastructure, COT position transparency, and exchange-cleared futures make systematic hedge fund deployment viable.
The question is not whether institutional capital will trade the Q3 2026 review. Every fund with a carbon desk will. The question is whether positioning heading into it will be as crowded as January 2026 — and whether the fundamental supply tightening thesis survives the political negotiation intact. Those two variables, independently modeled and stress-tested against the legislative calendar, define the trade.
Fact-Check Notes
This article was independently verified against primary sources through multiple revision rounds. Key corrections made from earlier drafts:
Bob Litterman’s Goldman tenure — corrected from “chief risk officer for 23 years” to reflect his actual career: 23 years total at Goldman Sachs, heading the firm-wide risk function from 1994 before leading the quantitative group in Asset Management. Sources: Wikipedia, Ceres bio, Minneapolis Fed interview.
Merz speech date — confirmed as Wednesday, February 11, 2026 (the Antwerp Industry Summit). The market reaction (6.5% open decline) occurred on Thursday morning, February 12. Confirmed by EU Perspectives (”The 11 February summit”) and ClearBlue Markets (”prices opened significantly lower the morning of February 12”).
Hoekstra “intellectually lazy” quote — sourced to Homaio’s Antwerp summit analysis, which directly quotes him. An earlier draft incorrectly sourced this to a Reuters article that did not contain the quote.
Article 6 bilateral deals — corrected from “only 15” to over 90. The IGES 2025 Implementation Status Report counts 99 formalized agreements across 61 Parties. Sources: Planet2050, Columbia SIPA, IGES A6ISR 2025.
MSR figure — stated as “approximately 276 million” to match the EU Commission’s own headline figure. Source: EU Commission, May 28, 2025.
EUA average price 2024 — stated as €65/tonne, matching ESMA’s directly reported figure. Source: ESMA Carbon Markets Report 2025.
All claims sourced directly from primary documents. Key sources: ESMA Carbon Markets Report 2025 · ING Think, February 2026 · ClearBlue Markets, February 2026 · Resonanz Capital Carbon Alpha Report · The Hedge Fund Journal — Andurand Interview · Hedgeweek — Kepos Capital · Hedgeweek — Carbon Cap Management · EU Commission MSR 2025–2026 · ICAP EU ETS Profile · Energy Economics — EUA Bubbles Study · Daniel, Litterman & Wagner, PNAS 2019 · Homaio — Antwerp Summit Analysis · EU Perspectives — Hoekstra at Antwerp · Bellona — Antwerp & EUCO · Columbia SIPA — Article 6 Operationalization · IGES Article 6 Implementation Report 2025 · Bob Litterman bio — Ceres · Minneapolis Fed — Litterman Interview
Cover photograph: Sludge G, CC BY-SA 2.0, via Wikimedia Commons.