


For the first time in modern commodity trading history, copper smelters are paying miners for the privilege of processing their ore. Treatment charges first turned negative on April 26, 2024 and deepened through 2025, with industry spot assessments near -$60 per tonne in November 2025. The annual benchmark collapsed from $80/t in 2024 to $21.25/t in 2025 — a 73% decline.
This is not a temporary dislocation. It’s a structural breakdown signaling the deepest supply shortage in modern markets.
The Structural Case: Why Sophisticated Capital Is Positioning
Jeff Currie, former Goldman Sachs commodities head now at Carlyle Group, called copper “the most compelling trade I have ever seen in my 30-plus years” on Bloomberg’s Odd Lots podcast in May 2024.
Pierre Andurand — who has publicly forecast prices as high as $40,000 per tonne over the next few years — saw his Commodities Discretionary Enhanced fund gain 50% in 2024 (press reports vary on exact performance figures; mid-year reports showed higher intra-year gains before final year-end figures). He describes copper as “a more structural trade than oil” and expects “the largest copper shortage ever witnessed.”
The thesis rests on a simple but unavoidable reality: new copper mines take 17.9 years from discovery to production globally, 29 years in the United States. The timeline has tripled since the 1990s due to longer permitting, environmental reviews, and financing delays.
Meanwhile, demand accelerates. Chile’s Cochilco projects concentrate deficits will deepen through 2025 as Chinese and Indonesian smelters come online while mine supply tightens 3.4%.
Primary Evidence: The TC/RC Collapse
Treatment and refining charges are the fees miners pay smelters to process copper concentrate into refined metal. They function as the revenue split between miners and smelters. When TC/RCs fall, it signals concentrate scarcity. When they turn negative, the system has broken.
TC/RCs first turned negative on April 26, 2024 and deepened through 2025. By November, industry spot assessments reached approximately -$60 per tonne. The annual benchmark system that governed commercial relationships for decades is fragmenting under physical tightness, with miners and smelters shifting to bilateral agreements and index-linked pricing.
This represents the first modern instance of structural shortage severe enough to invert the traditional revenue split. Smelters continue operating because: (1) annual contracts signed in 2024 still carry positive TC/RCs, and (2) byproduct revenues from sulfuric acid, gold, and silver offset losses. But these supports are temporary.
Currie projects prices could reach $12,500 to $15,000 per tonne within 12 to 18 months as concentrate shortages filter through to refined copper. He cites green capex, AI infrastructure, and military applications as demand drivers against 12 to 26-year mine development timelines that cannot respond.
Historical Context: What Happens When Markets Corner
Court Documents: The Sumitomo Precedent (1995–1996)
Yasuo Hamanaka controlled 93% of all outstanding LME copper warrants by November 1995 in an attempt to corner the market. His positions resulted in $2.6 billion in losses for Sumitomo Corporation.
Court filings revealed Hamanaka maintained secret books, forged signatures, and borrowed $400 million from JP Morgan and $500 million from Chase Manhattan to sustain positions. The CFTC fined Sumitomo $150 million. Settlements followed: Merrill Lynch paid $275 million, JP Morgan $125 million, and Credit Lyonnais Rouse’s $1.1 billion claim was settled confidentially. (Settlement and loan amounts are variously reported in archival press; several claims were confidential.)
The lesson: 5% market control equals existential risk. Position sizing must not exceed market liquidity. Hamanaka’s dominance created artificial backwardation that eventually collapsed when exposed.
Court Documents: Red Kite vs Barclays (2010–2013)
In 2017, Red Kite Management sued Barclays for $850 million in damages, alleging the bank’s proprietary traders accessed confidential trading information to front-run positions between 2010 and 2013.
Court documents claimed Barclays used “ramping” to manipulate LME closing prices. The case settled confidentially in April 2019.
The lesson: counterparty due diligence on information leakage is essential. Prime brokers can leak positions. Monitor for front-running and manipulation, particularly around LME closing auctions.
Current Institutional Positioning
Ben Cleary at Tribeca Investment Partners maintains a bullish stance on copper, with the fund described as “highly convicted” on the metal. Tribeca’s holdings include major copper producers such as Freeport-McMoRan, Teck Resources, and Glencore.
Tavi Costa at Crescat Capital identifies a “major shortage of above-ground copper” despite ample reserves underground. The firm invests in exploration companies targeting new discoveries, noting average discovery-to-production timelines approaching 18 years.
S&P Market Intelligence and filings show sizeable re-allocations among institutional managers in Q3 2025 — for example, Wellington Management materially increased copper exposure while Capital World Investors sharply reduced it — consistent with active portfolio rebalancing into the metal.
Market Evidence: ETFs and Physical Flows
The Global X Copper Miners ETF (COPX) returned 93.4% for calendar 2025, with holdings in KGHM, Lundin Mining, Boliden, Hudbay, Freeport, and Southern Copper. The US Copper Index Fund (CPER) gained 39% in 2025 tracking futures via the SummerHaven Copper Index.
In May 2024, the LME-COMEX spread exceeded $1,000 per tonne as ultra-low COMEX inventories combined with speculative longs created a short squeeze. Physical copper diverted from China to US warehouses.
Ahead of potential US tariffs, Trafigura, Glencore, Mercuria, and IXM accumulated approximately 600,000 tonnes of physical copper, generating profits exceeding $300 million from arbitrage trades. This demonstrates how physical supply constraints create profitable dislocations.
LME Mechanics: Concentration Risk
LME dominant position rules define control as 80%+ of available stocks. Historical concentration events include:
Hamanaka’s 93% (November 1995): Led to $2.6B loss and prison
October 2021 squeeze: Stocks fell to 14,150 tonnes (lowest since 1974), cash premium reached $1,103.50/tonne, LME imposed spread caps
January 2026: Tom/Next spreads spiked to highest levels since 2021 squeeze amid tight exchange inventories
These episodes demonstrate that copper markets remain susceptible to concentration risk. The combination of low exchange inventories and rising speculative interest creates conditions for squeezes.
The Trade Structure
Tactical (6–18 months):
Long COMEX copper futures
Long call options (3–6 month, 10–15% OTM)
COMEX-LME spread trades
Structural (3–5 years):
Long Sprott Physical Copper Trust
Long producers with operating leverage:Freeport-McMoRan: ~$400–450 million EBITDA sensitivity per $0.10/lb move, Southern Copper: ~26–35% FCF margin, Antofagasta: ~58–60% EBITDA margin
Long COPX ETF
Risk Management Framework
The Sumitomo and Red Kite cases provide clear lessons:
Position Sizing: Hamanaka’s 5% market control destroyed $2.6 billion. In illiquid physical markets, even small percentage ownership creates existential risk. Size positions to market liquidity, not conviction.
Information Security: The Red Kite case demonstrates that prime brokers can leak confidential information. Use multiple counterparties. Monitor for unusual price action around known positions. Watch LME closing auctions for manipulation.
Leverage Discipline: Avoid leverage exceeding 2x on directional positions. Copper’s 17-year supply cycles create extended trends, but interim volatility can force liquidation at worst possible times.
Stop-Losses: Use technical stops, not fundamental ones. The market can remain oversupplied or undersupplied longer than positions can remain solvent.
Conclusion: The Asymmetric Setup
When smelters pay miners to process ore, structural shortage has arrived. Jeff Currie’s highest-conviction call in 30 years, Pierre Andurand’s $40,000 target, and institutional positioning across Wellington Management, Tribeca, and Crescat represent sophisticated capital positioning for supply-demand dislocation.
The TC/RC collapse to -$60 per tonne, 17.9-year mine development timelines globally (29 years in the US), and accelerating concentrate deficits create the most asymmetric commodity trade of the decade.
Three factors make this structural, not cyclical:
Supply cannot respond: 17.9-year global timelines (29 years in the US) mean mines discovered today won’t produce until 2043
Demand is accelerating: Electrification, AI infrastructure, and military applications increase copper intensity across the economy
Physical evidence is definitive: -$60 TC/RCs prove concentrate scarcity has reached system-breaking severity
For patient capital willing to size appropriately and manage tail risks documented in Sumitomo and Red Kite, copper represents a generational opportunity where fundamental analysis, historical precedent, and current market structure align.
The question is not whether shortage arrives. TC/RCs at -$60 confirm it already has. The question is how high prices must rise before 17-year development timelines can restore equilibrium.
📊 Want Deeper Quantitative Analysis?
This research took very long time of data collection, verification, and analysis. If you found value in this deep-dive, I publish exclusive quantitative research, trading strategies, and institutional-grade analysis on Patreon.
By joining, you’ll be supporting my work and motivating me to publish more content like this.
→ Join the Patreon community here
Sources & Data:
TC/RC data: Fastmarkets, Crux Investor, S&P Global
Mine timeline data: S&P Global Market Intelligence
Expert quotes: Bloomberg, Mining.com, The Hedge Fund Journal
Institutional flows: S&P Market Intelligence, company filings
ETF performance: Yahoo Finance (calendar 2025 data as of December 31, 2025)
Historical cases: Wikipedia, Washington Post, Bloomberg
LME rules: London Metal Exchange policy documents
Connect: LinkedIn | YouTube — The Mathematical Trader
Note: This article represents analysis and research, not investment advice. Commodity trading involves substantial risk of loss.
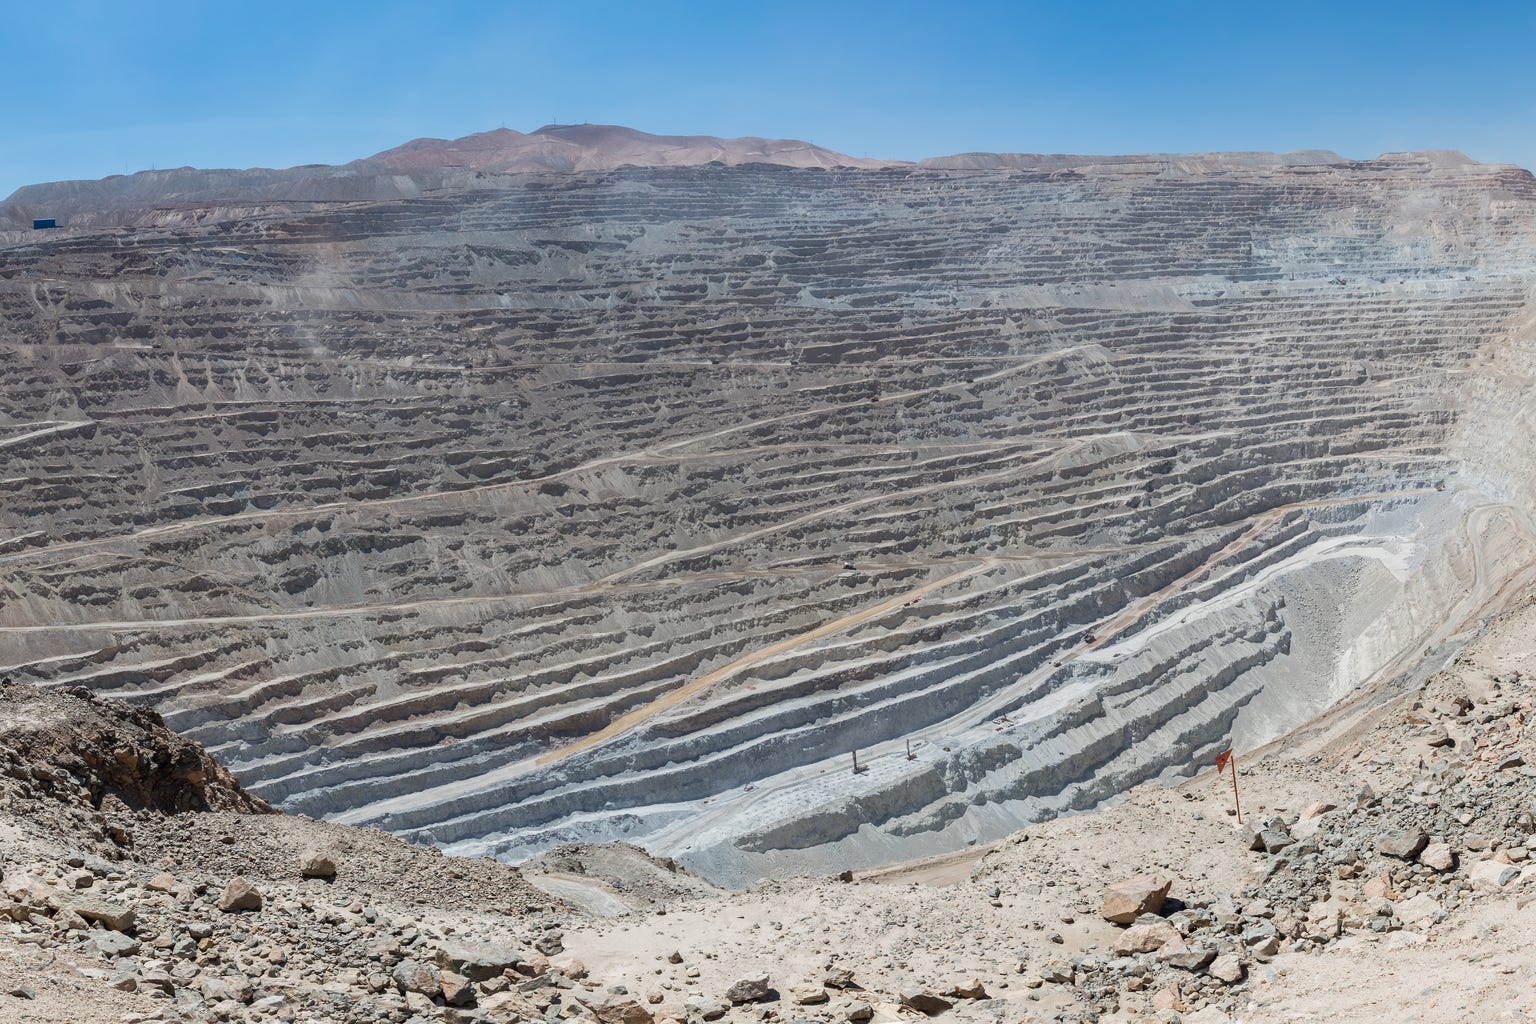
Cover photograph: Diego Delso, CC BY-SA 4.0, via Wikimedia Commons.