



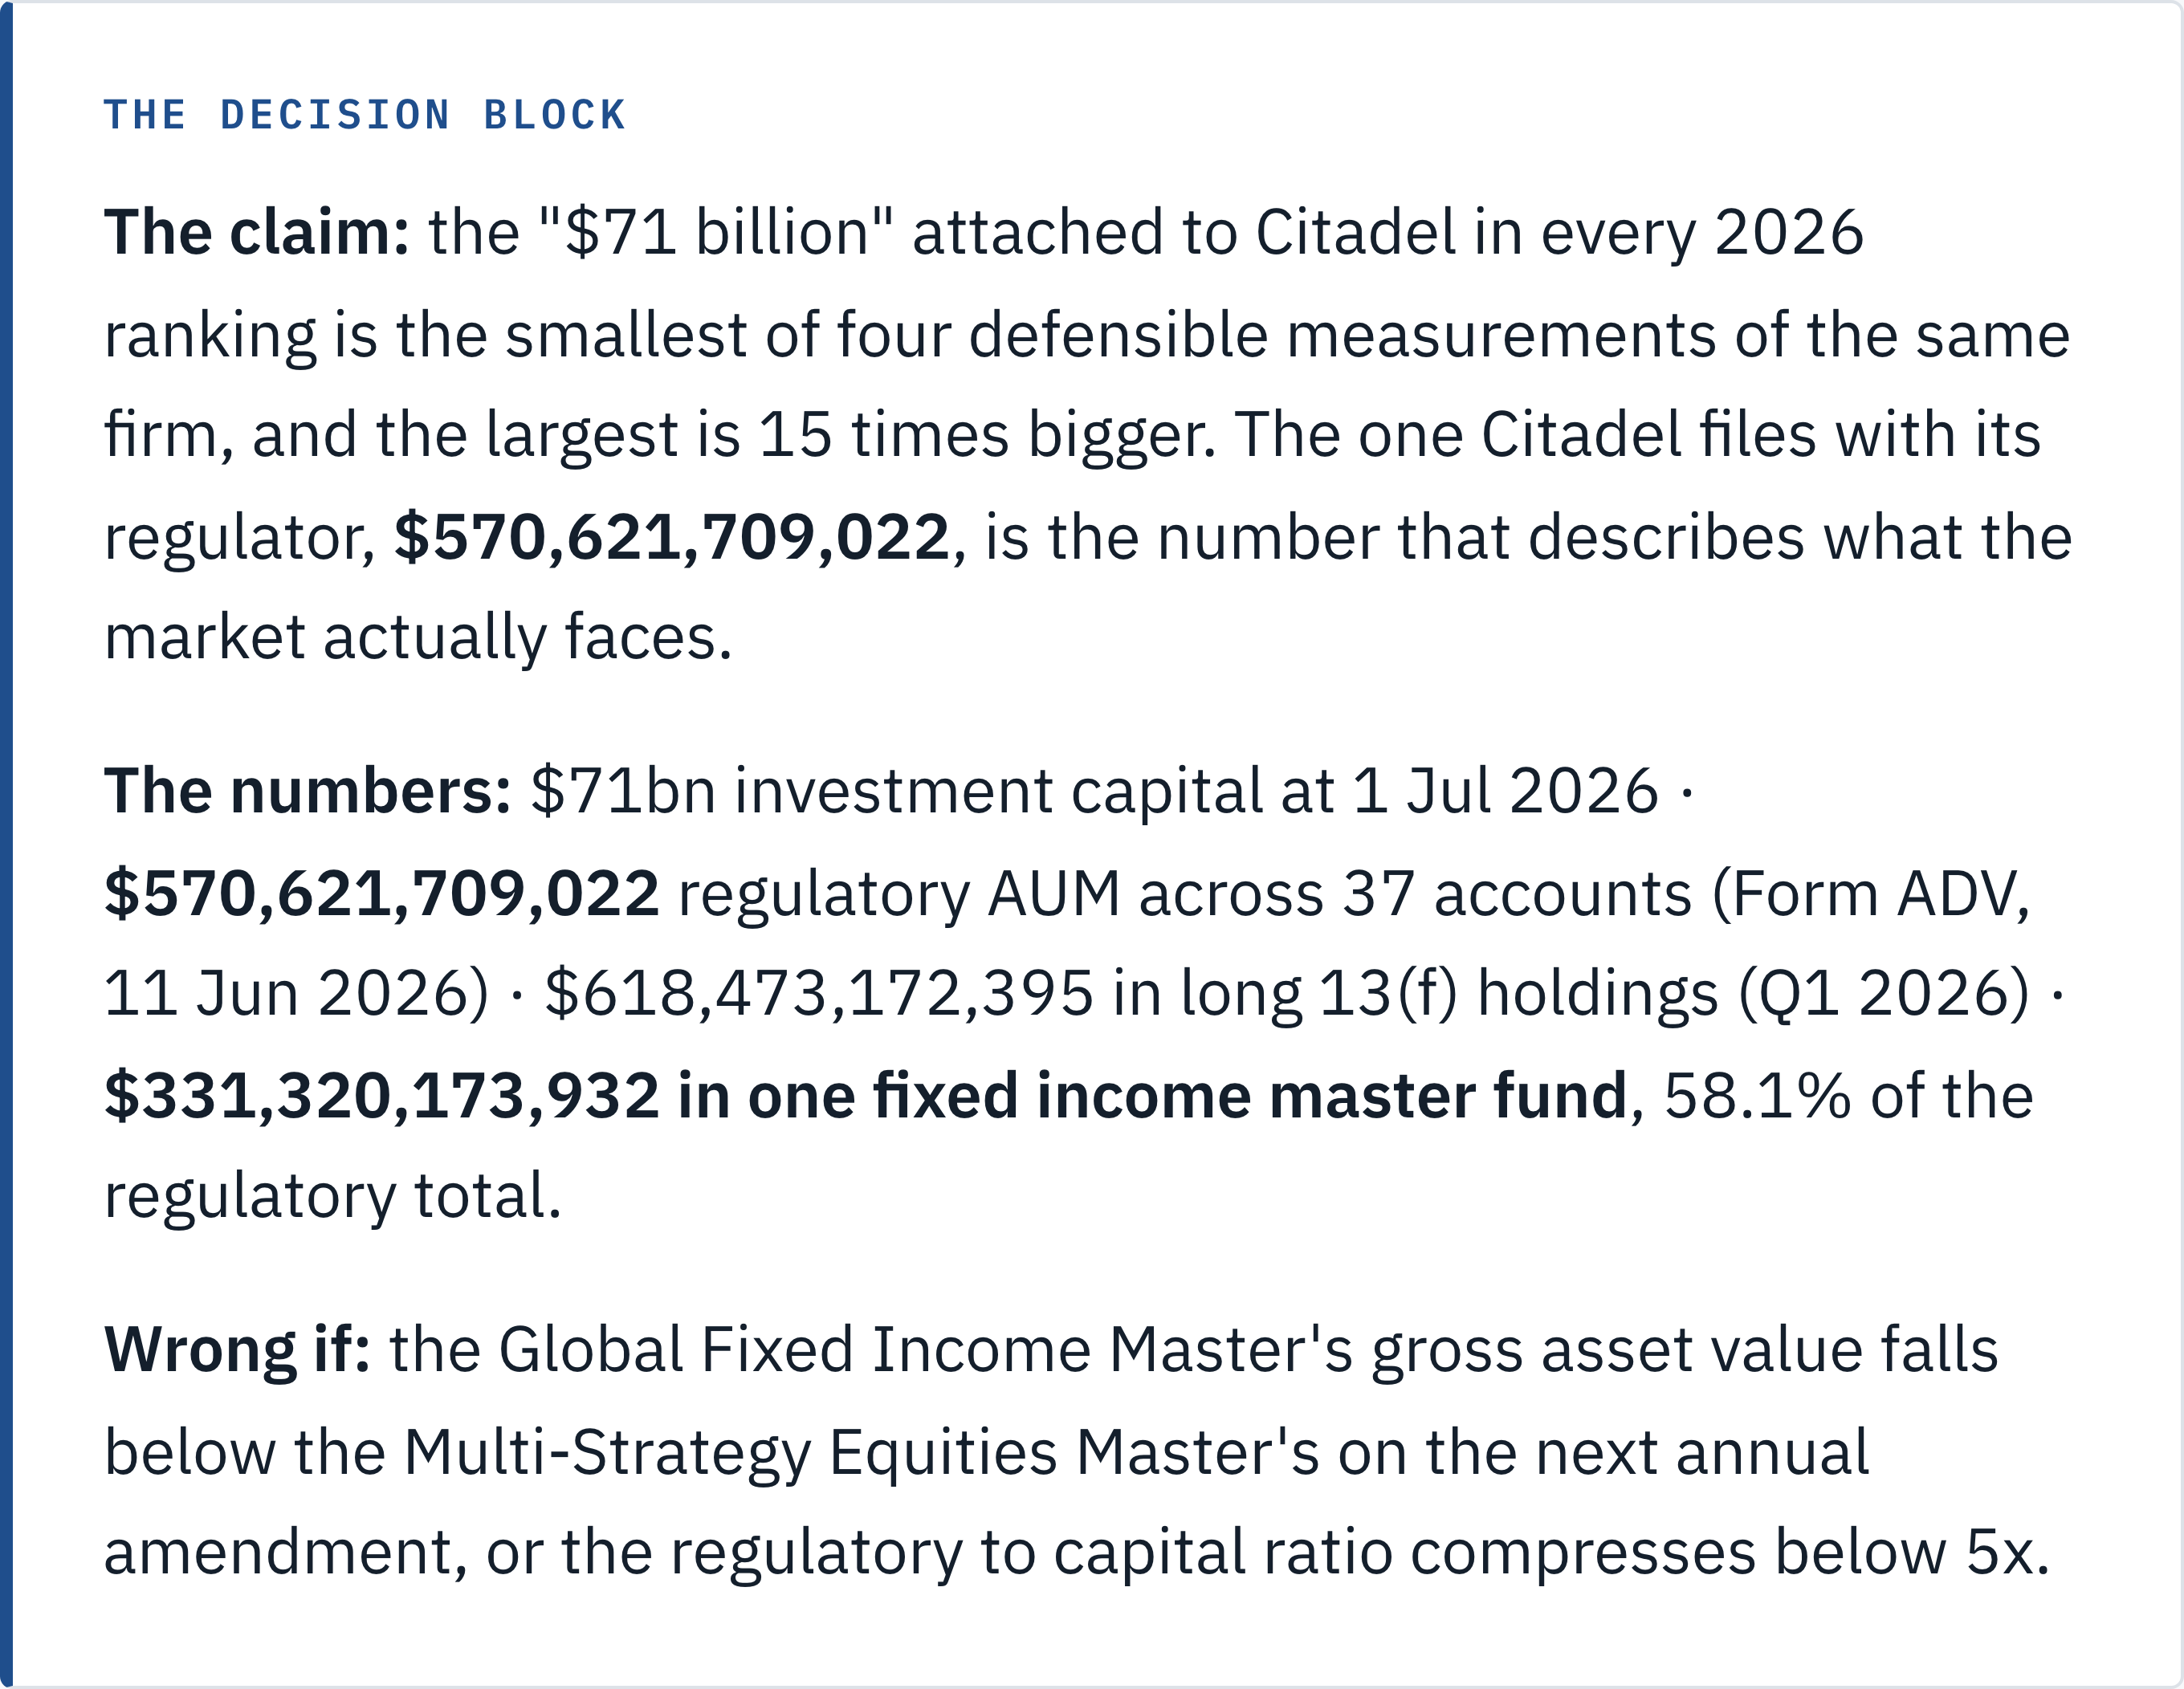
The claim: The “$71 billion” attached to Citadel in every 2026 ranking is the smallest of four defensible measurements of the same firm, and the largest is 15 times bigger. The one Citadel files with its regulator, $570,621,709,022, is the number that describes what the market actually faces. Size counterparty, financing or crowding risk off the league table figure and you are out by a factor of eight, on a correction that costs one free PDF.
The numbers: $71bn investment capital as of 1 July 2026 (press, two independent chains) · $570,621,709,022 regulatory assets under management across 37 accounts (Form ADV, filed 11 June 2026) · $618,473,172,395 in long 13(f) holdings (13F-HR, Q1 2026) · $331,320,173,932 in one fixed income master fund, 58.1% of the regulatory total.
The catalyst: Citadel’s Q2 2026 13F is due 14 August 2026, unfiled as this went out. Its next annual Form ADV amendment restates every fund’s gross asset value by roughly 31 March 2027.
Wrong if: the Global Fixed Income Master’s gross asset value falls below the Multi-Strategy Equities Master’s on the next annual amendment, or the regulatory to capital ratio compresses below 5x.
The $71 billion is accurate, and it answers a question about investors
Start with the consensus at its strongest, because it isn’t wrong.
CNBC’s reporting has it that Citadel “managed some $71 billion in assets on July 1”; the FT, reporting separately, called it “more than $71 billion in assets”. Two newsrooms, one figure. It’s investor capital: the equity clients and insiders have committed, the base performance is struck on, the denominator behind “Wellington returned 5.9% in July.”
Citadel controls that number deliberately. The firm returned about $5 billion of 2025 profits at the start of this year, taking capital from $72bn to $67bn, and has handed back $32bn since 2017.
I checked whether the capital path since then is anything other than performance, and it isn’t. Wellington returned 5.7% in the first half. Multiply $67bn by 1.057 and you get $70.8bn, against a reported “about $71 billion” on 1 July. Work it backwards from 12% through July and 5.9% in July alone and the implied first half is 5.76%. Both routes land in the same place. The base is closed. Nobody subscribed, and the growth is the portfolio’s.
So my quarrel isn’t with the figure. It’s with what people think it measures.
Item 5.F, filed 11 June 2026: $570,621,709,022 across 37 accounts
Citadel Advisors LLC files its Form ADV under CRD 148826, from 830 Brickell Plaza, Floor 15, Miami. The current filing is dated 11 June 2026. Item 5.F reads:
Discretionary regulatory assets under management, $570,621,709,022. Non-discretionary, zero. Total accounts, 37. Of that, $384,834,614,984 sits with clients who are not United States persons, or 67.4%. Item 5.D assigns every dollar to one category, pooled investment vehicles. Item 5.A reports 3,284 employees, 1,314 in investment advisory functions.
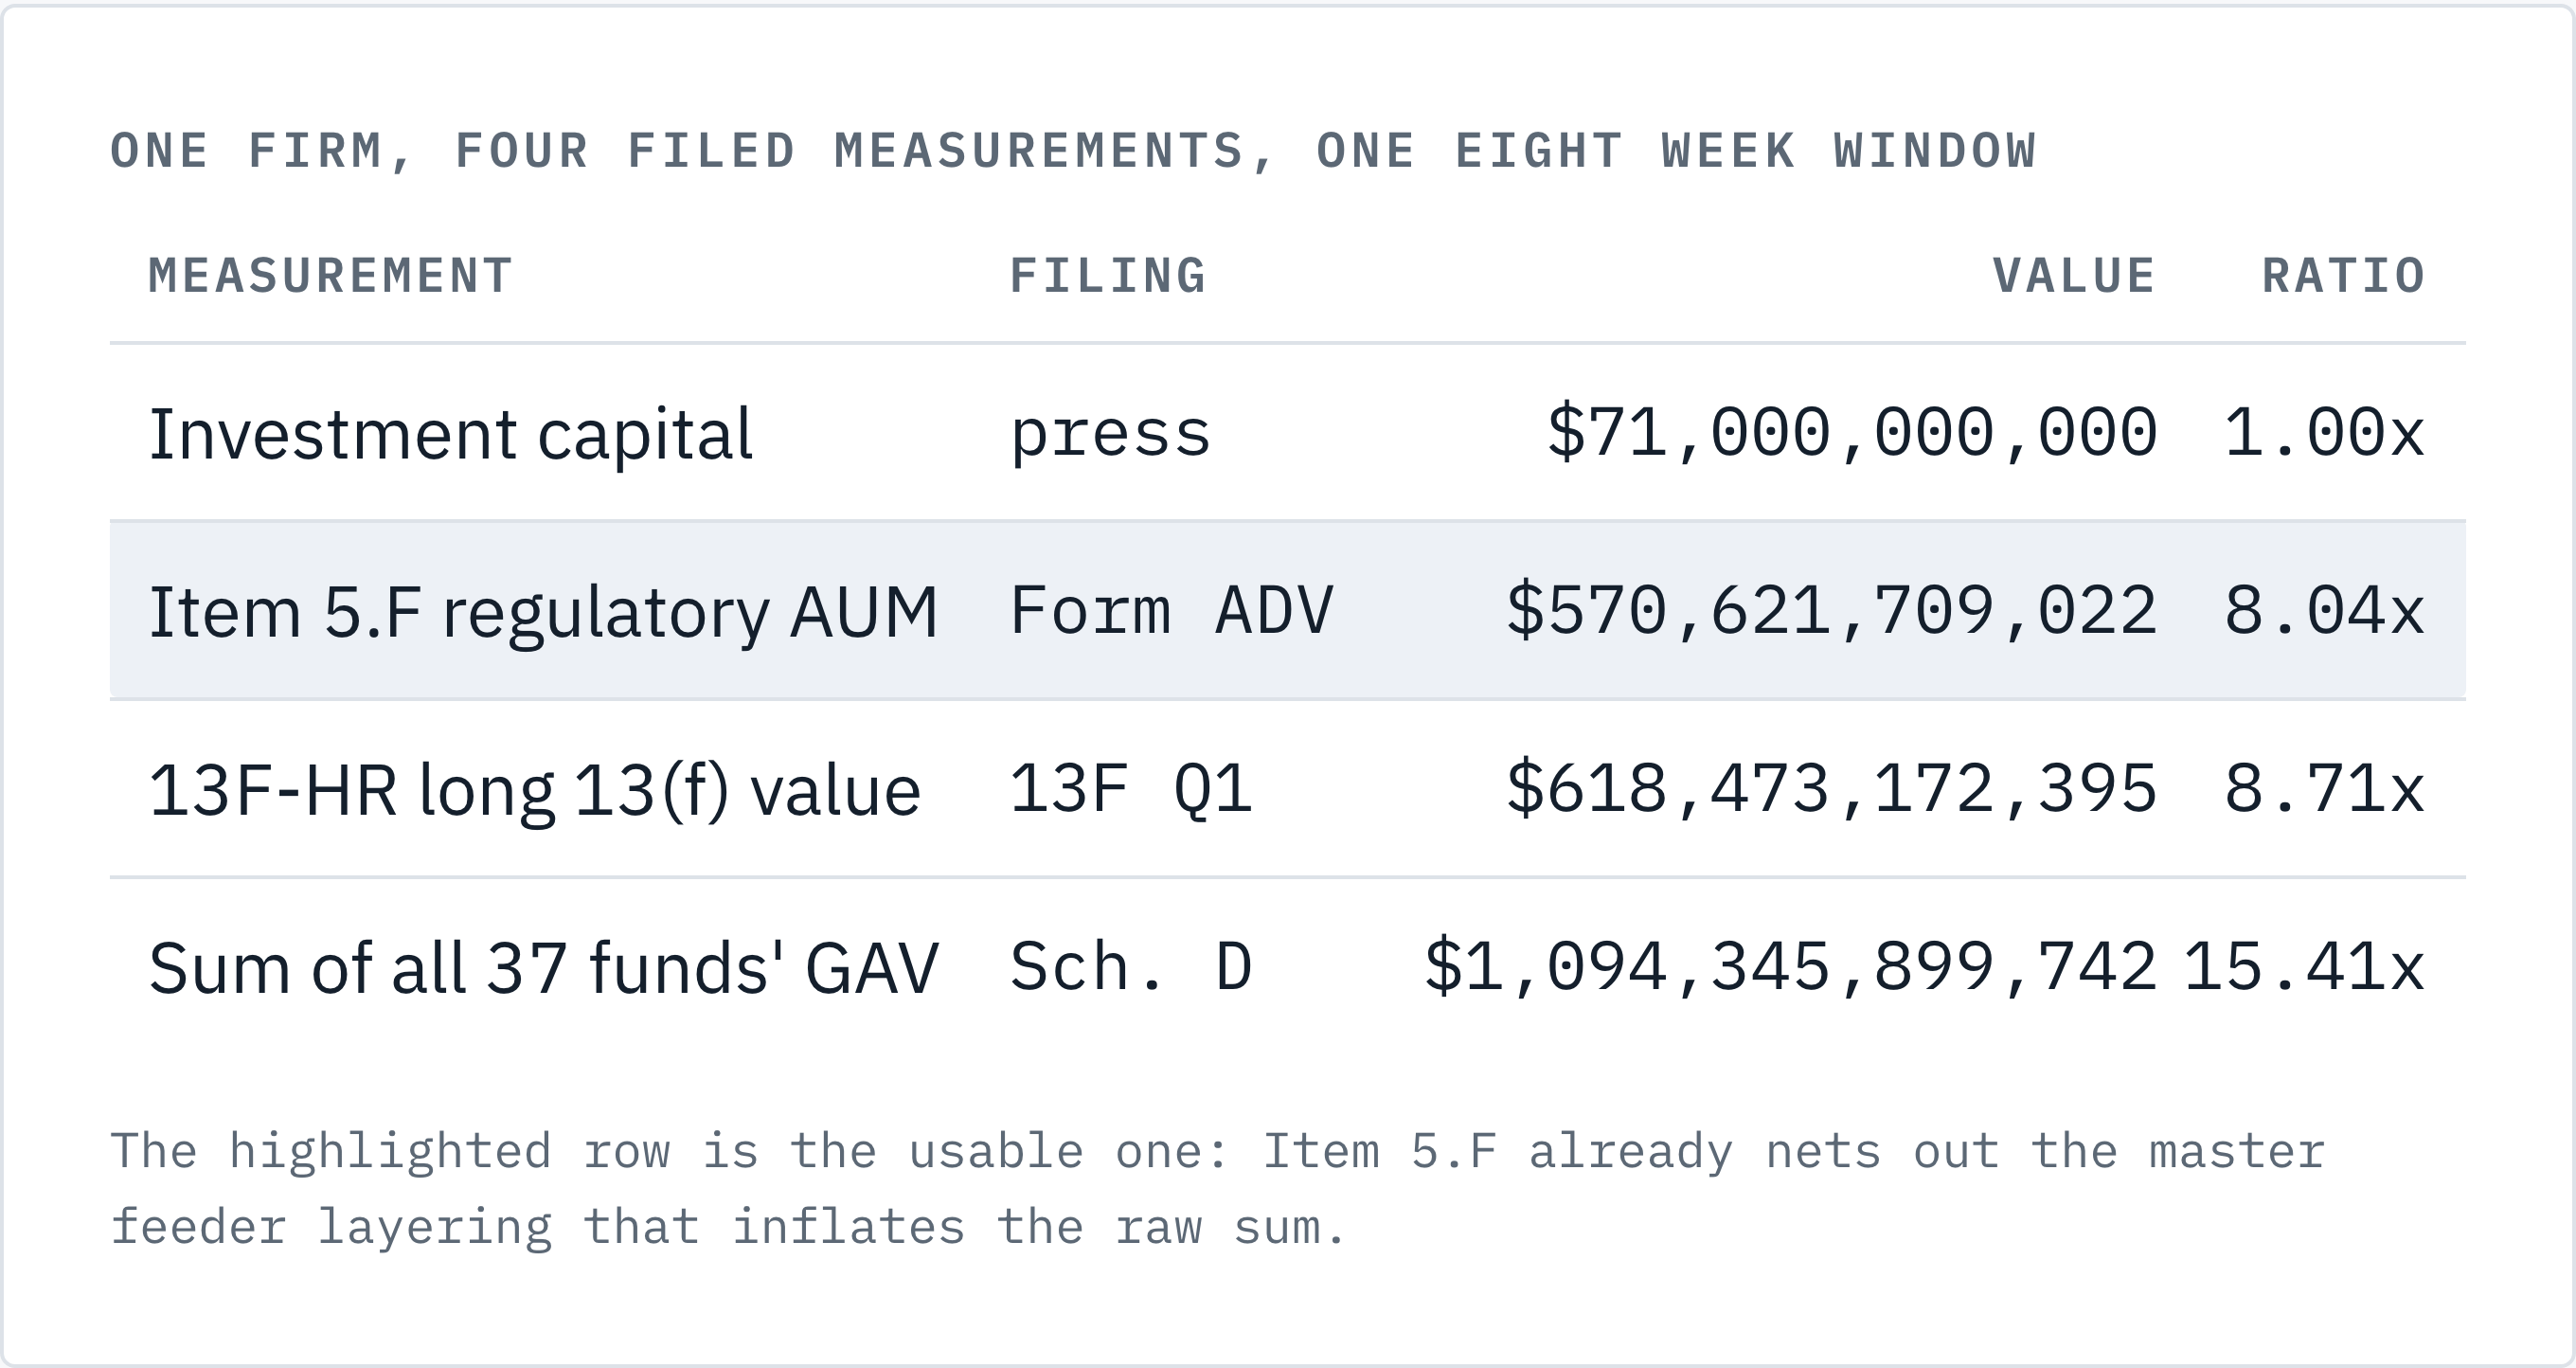
That is 8.04 times the $71 billion.
A third measurement sits in a different filing. Citadel Advisors’ 13F-HR for the first quarter of 2026, filed 15 May on a 45 day lag, reports positions as they stood on 31 March: a table value total of $618,473,172,395 across 15,589 lines. A fourth sits back inside the ADV: Schedule D requires a separate entry for every private fund, each carrying its own current gross asset value. Summed across all 37, those entries total $1,094,345,899,742.
One firm, one reporting window give or take eight weeks. $71bn, $570.6bn, $618.5bn, $1,094.3bn. The spread from smallest to largest is 15.4x, and I’d call every one a real number somebody filed on purpose. Citadel disclosed all four accurately and on time, so my argument is with the people quoting them and not with the filer. One became the shorthand, and now does work it was never built for.
The SEC instruction that creates the gap: “Do not deduct any outstanding indebtedness”
I do not read that gap as a discrepancy. It is written into the form.
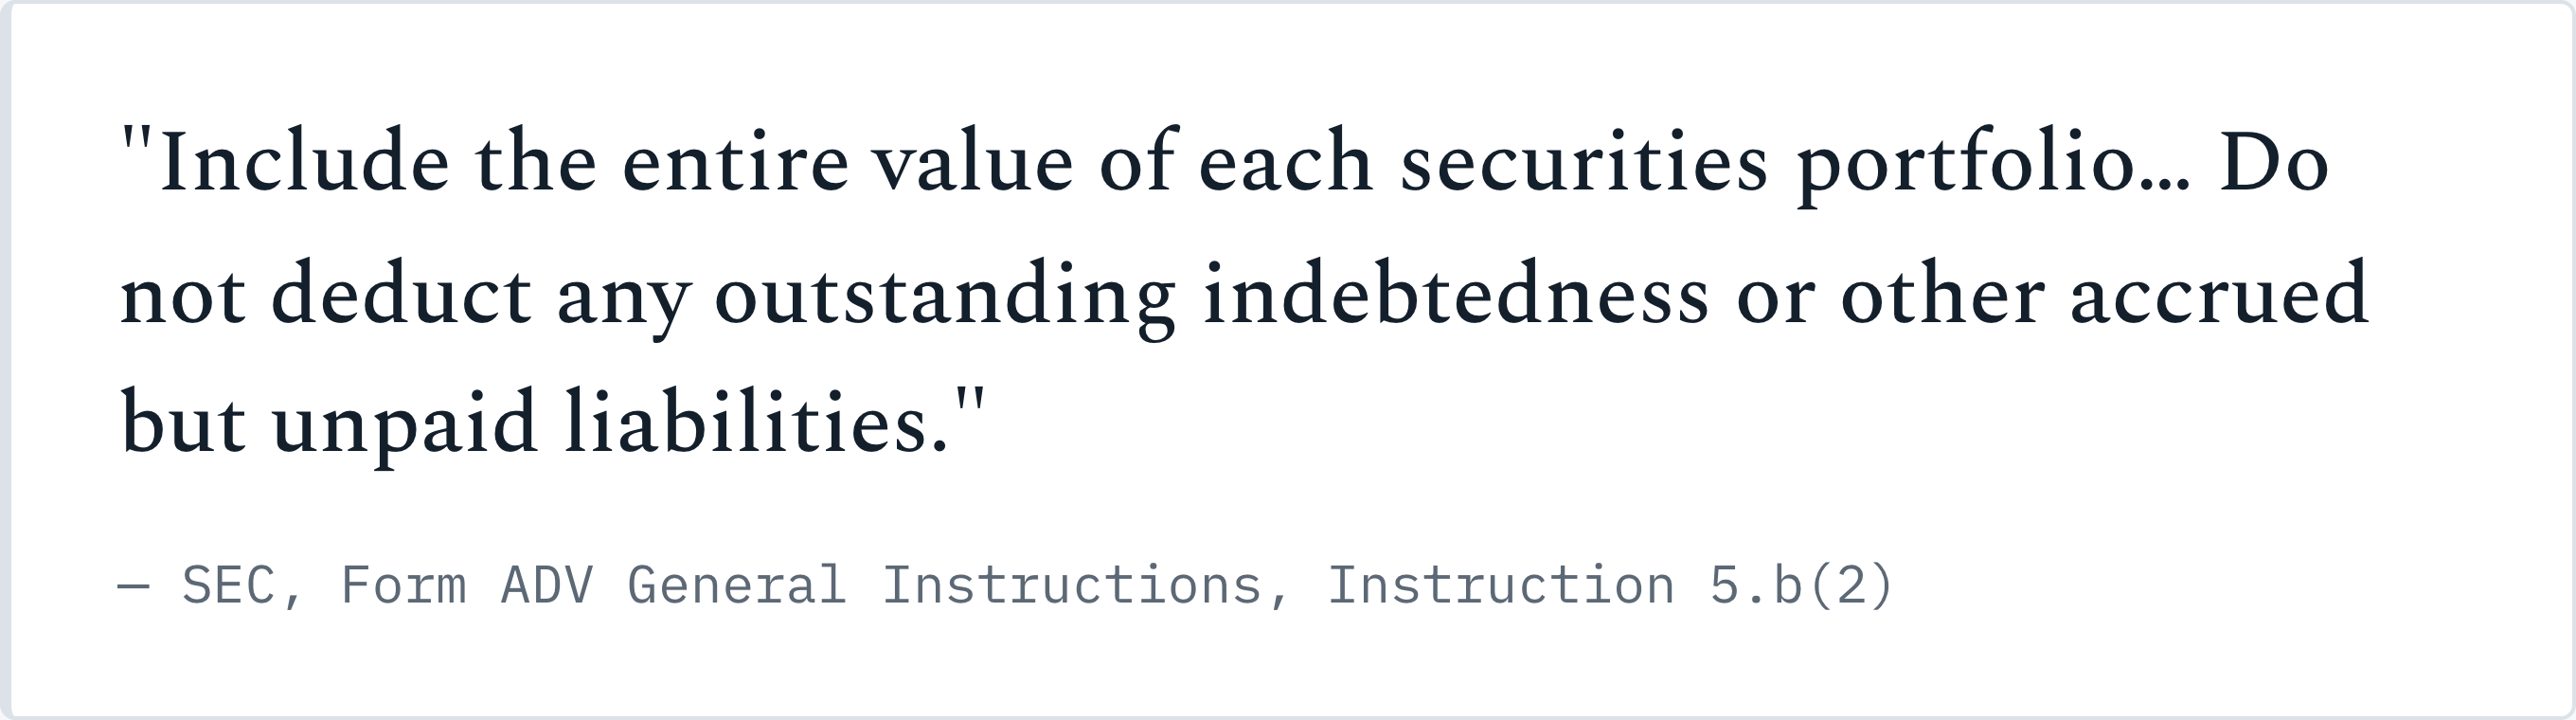
The SEC’s Form ADV instructions, at Instruction 5.b, tell an adviser how to compute Item 5.F. Two sentences do the work. First: “treat all of the assets of a private fund as a securities portfolio, regardless of the nature of such assets.” Second, and this is the operative one: “Do not deduct any outstanding indebtedness or other accrued but unpaid liabilities.“
Regulatory AUM is a gross assets measure by construction. Buy a Treasury bond with repo financing and the bond enters Item 5.F at full market value while the repo liability enters nowhere. Investment capital is a net equity measure. These are not two estimates of one quantity. They are the numerator and denominator of a financing ratio, and 8.04x is that ratio.
That reframing is the whole argument. Nobody is quoting the wrong number. Two numbers that divide into each other are being treated as rivals for the same job, and the division is where the information sits.
I should be honest about how novel this is. Securities lawyers have written the gross point up for years, in these words: a fund adviser “is required to include all gross assets without any deduction for debt or leverage”. What I can’t find anyone doing is the next step: taking it out of the compliance filing to size a named firm’s footprint, then running it across the cohort. The rule is documented. The application isn’t.
The 13F number is gross in a third and stranger way. It captures long positions in 13(f) securities only: no shorts, no bonds, no futures, no non-US listings. It also aggregates other included managers, and Citadel’s names one: Citadel Securities GP LLC. The market maker’s inventory rides inside the hedge fund adviser’s 13F, which squares with the ADV listing fifteen affiliated broker dealer and clearing entities as related persons. Read it as “Citadel’s portfolio” and you’re reading a market maker and a hedge fund added together, shorts deleted.
The feeders hold $74.6bn. The masters they feed hold $530.1bn.
Schedule D showed me exactly where the $71 billion lives.
Three of the funds are the investor facing vehicles. Citadel Wellington LLC, the onshore flagship, reports gross assets of $30,935,735,414 across 309 beneficial owners, 0% non-US. Citadel Kensington Global Strategies Fund Ltd., the offshore twin, reports $30,105,876,076 across 372 owners. Kensington II adds $13,533,767,845. Together, $74,575,379,335, or 1.05x the stated $71bn of investment capital.
I didn’t have to guess at which three. KBRA’s affirmation of 21 April 2026 names exactly that set. The issuer pays for the rating and supplies much of the data, so I lean on it for facts Citadel has no reason to misstate, never for judgement. On that basis it corroborates the three vehicles I picked out of Schedule D by owner count. The investor sits in $74.6bn, inferred and then confirmed.
Now the funds those feeders feed:
$530.1bn of master fund assets standing on $74.6bn of feeder vehicles, a ratio of 7.11x. Double counting inflates the $1.09tn total, and it’s visible here too: GFIL Holdings Ltd. reports $290,469,065,838 with three owners, and it is a holding layer above the same fixed income assets. Item 5.F’s $570.6bn already nets that layering out, which is why I lean on it rather than on the sum.
One line in the Wellington entry deserves care, because it’s where I nearly got this wrong. Question 14 asks what share of the fund is beneficially owned by the adviser and its related persons, and for Wellington LLC the answer is 53%. Read fast, that says the onshore flagship is majority inside money. KBRA, with management access, puts principals and employees at 18% of the capital base. Both hold, because Form ADV counts as a related person any entity under common control, which sweeps in affiliated holding vehicles nobody owns personally. 18% is the number I’d use, and it’s still a large insider share.
58.1% of the regulatory total sits in one fixed income fund
Here’s the finding I didn’t expect when I opened the filing.
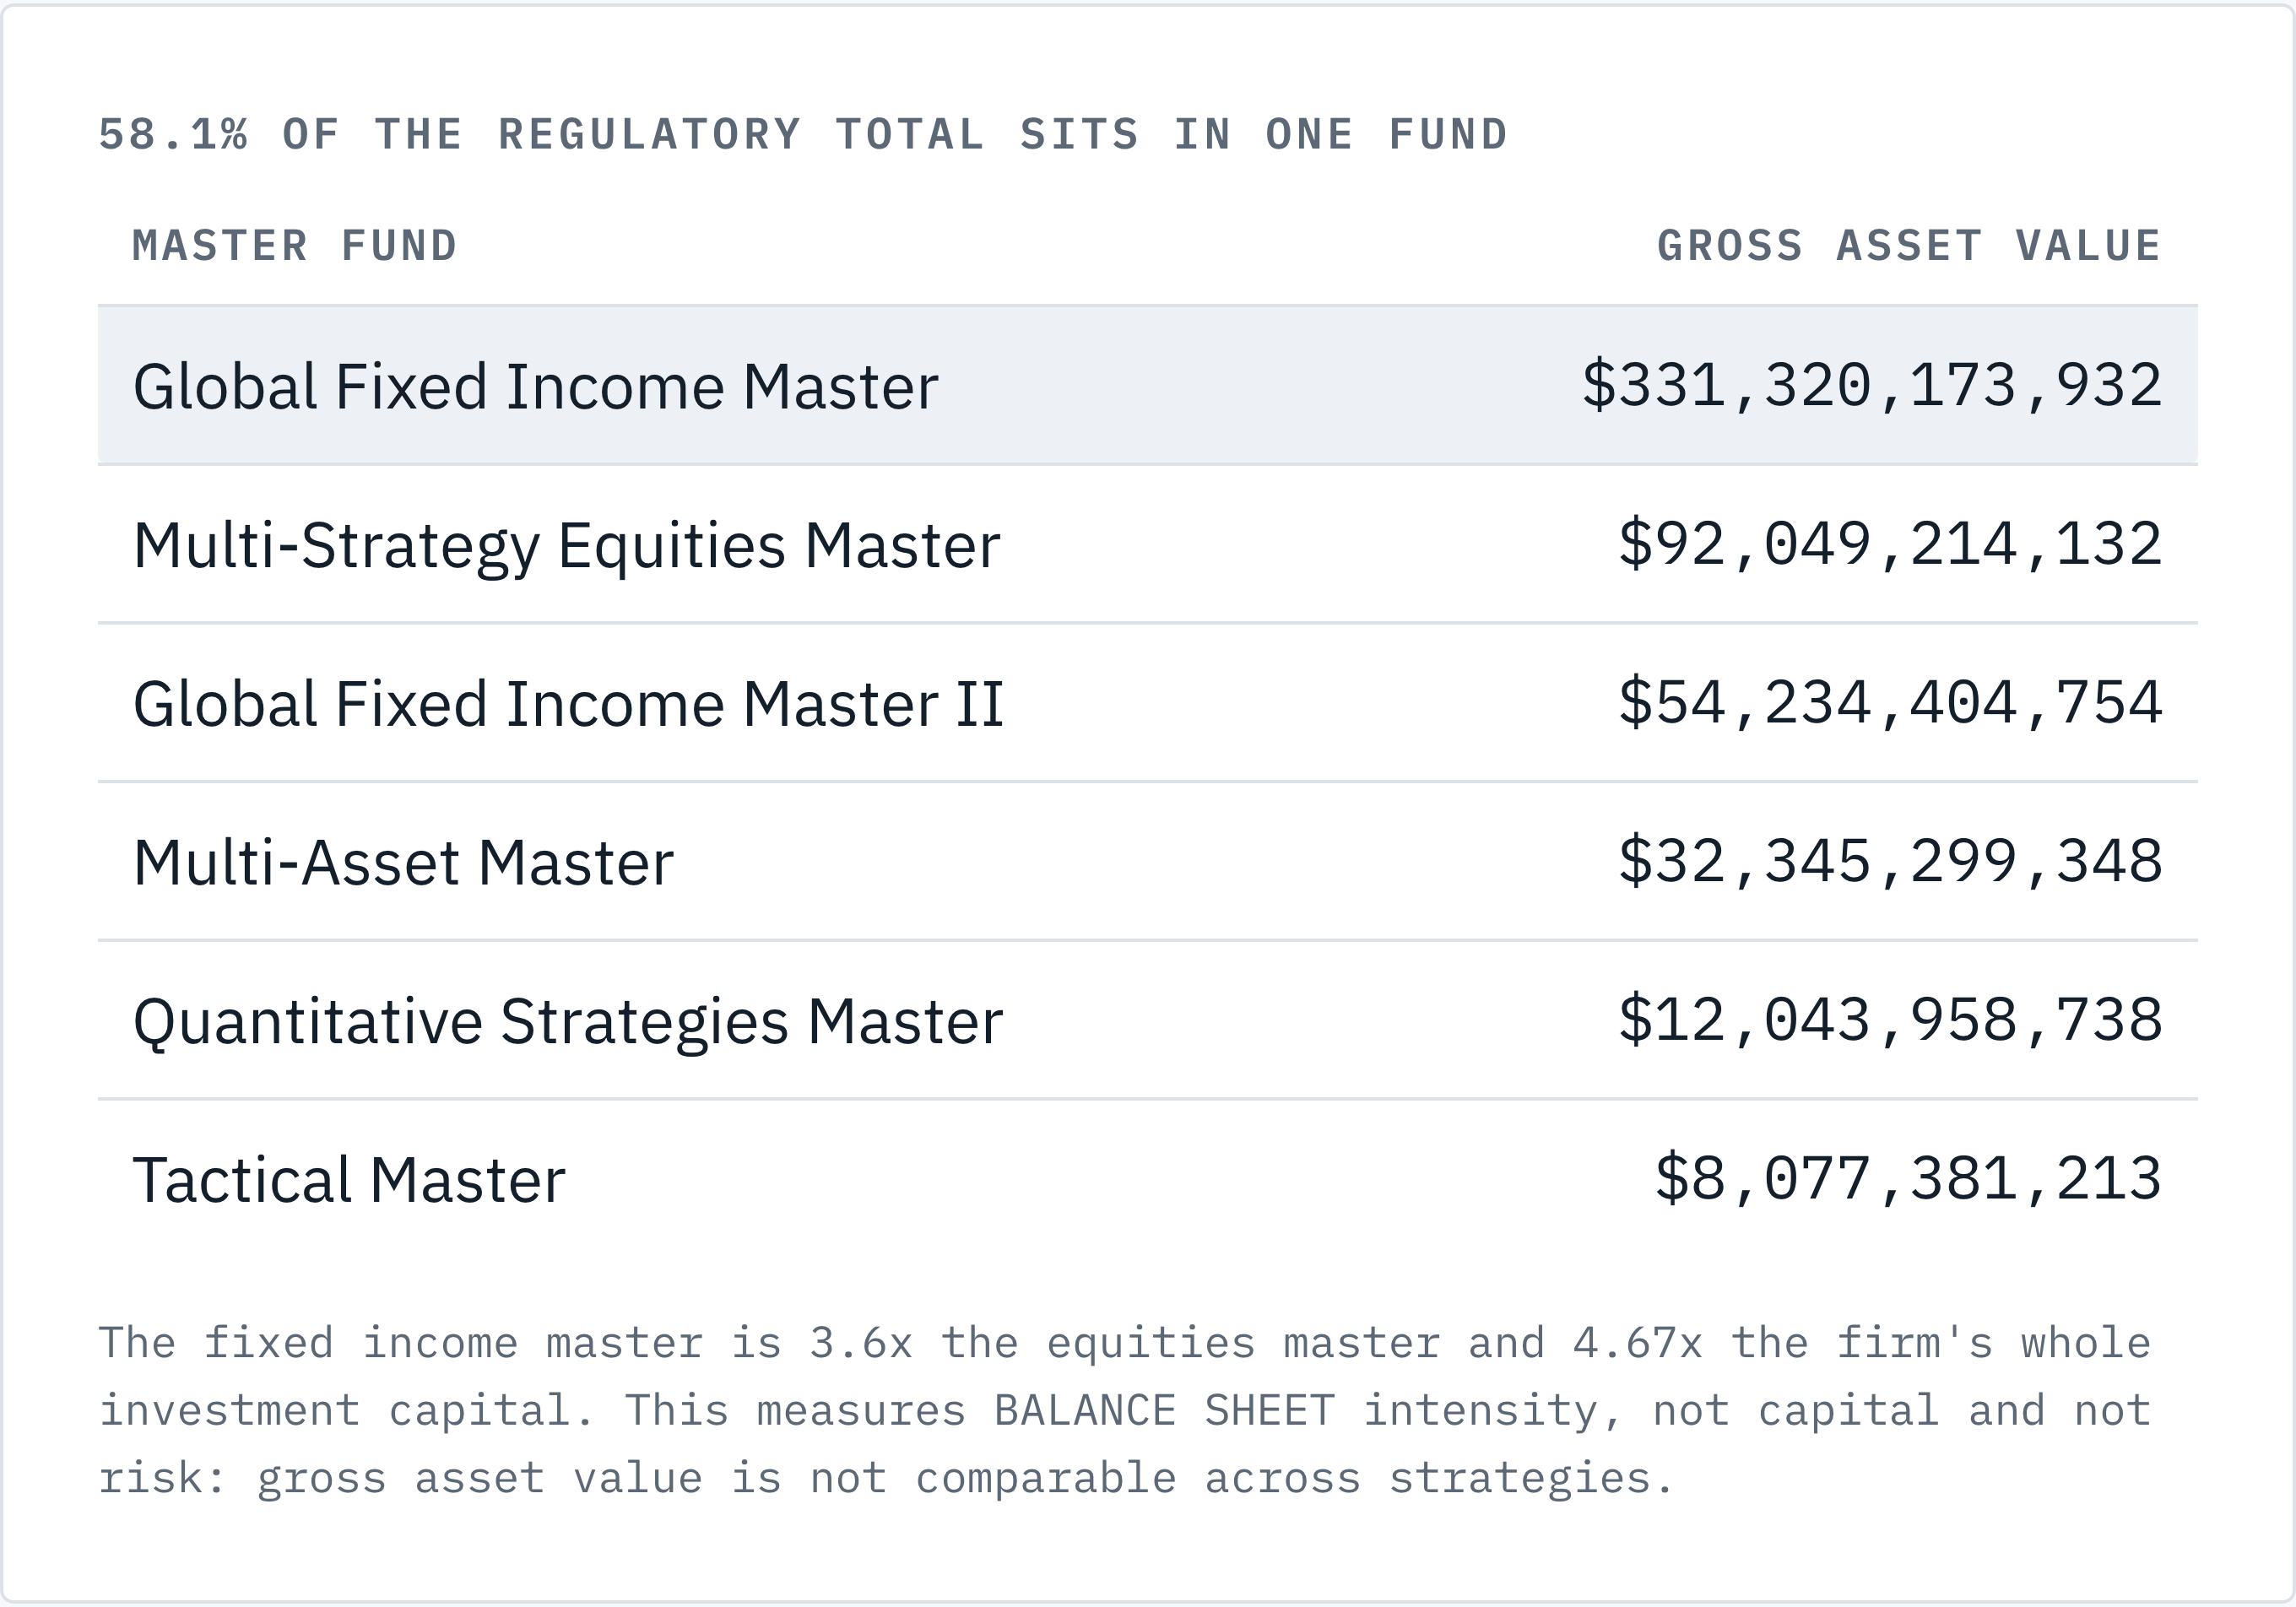
Citadel gets discussed as an equity firm: the pods, the stock pickers, the July headline about Situational Awareness. Its own filing describes something else. The Global Fixed Income Master Fund carries $331,320,173,932, which is 58.1% of the entire $570.6bn regulatory total and 4.67x the firm’s whole investment capital. Its Multi-Strategy Equities Master carries $92,049,214,132. The fixed income master is 3.6 times larger than the equities master. Group every fixed income vehicle in the schedule and you reach $692,146,644,790, or 63.2% of the gross sum, layering included on both sides of that ratio.
Here’s the objection I’d raise if somebody showed me this, and it nearly killed the finding. Gross asset value isn’t comparable across strategies. A cash and carry Treasury position books both legs; a long equity position books once. If the fixed income book runs at 15x gross to capital and the equity book at 3x, then $331bn and $92bn imply something like $22bn and $31bn of capital, and the equity business is the larger one. I can’t rule that out. The capital split lives in Form PF and Form PF is not public.
So take it narrowly, which is how I take it. This is where the BALANCE SHEET sits; capital and risk are separate questions. The balance sheet still determines financing, counterparty exposure and footprint, and it’s still the thing nobody quotes.
Performance points the same way. In March 2026 Citadel’s Global Fixed Income fund fell 8.2% in a single month, a drawdown the trade press attributed to rate volatility and widening basis spreads. I treat that attribution as a reporter’s reconstruction and I would not underwrite it. The magnitude is what I would hold onto. A strategy nobody puts in the headline moved 8.2% in a month, and it is the largest thing the firm runs.
Gross measures footprint. The Fed’s $4.0 trillion nets to $0.8 trillion.
An obvious objection: I’ve discovered leverage and dressed it up as insight. Eight times gross sounds alarming, so let me argue the other side properly, because a careful person reaches it first.
A relative value fixed income book is gross heavy by construction and carries little directional risk. Buy the cash Treasury, short the future, finance the cash leg in repo. Both legs count at full value. Net, you own a few basis points of price difference. Enormous in gross, nothing in net.
Precisely this has now been quantified by the Federal Reserve. In a FEDS Note published 22 June 2026, Phillip J. Monin decomposes large hedge funds’ Treasury exposures from Form PF: $4.0 trillion gross as of September 2025, made up of $2.4 trillion long and $1.6 trillion short. Net those and you have $0.8 trillion, 20% of the gross figure. The cash futures basis trade alone runs about $830 billion, roughly double its early 2020 peak and 35% of long Treasury exposure, financed inside $3.0 trillion of repo borrowing that the OFR attributes to multi-strategy, macro and relative value funds.
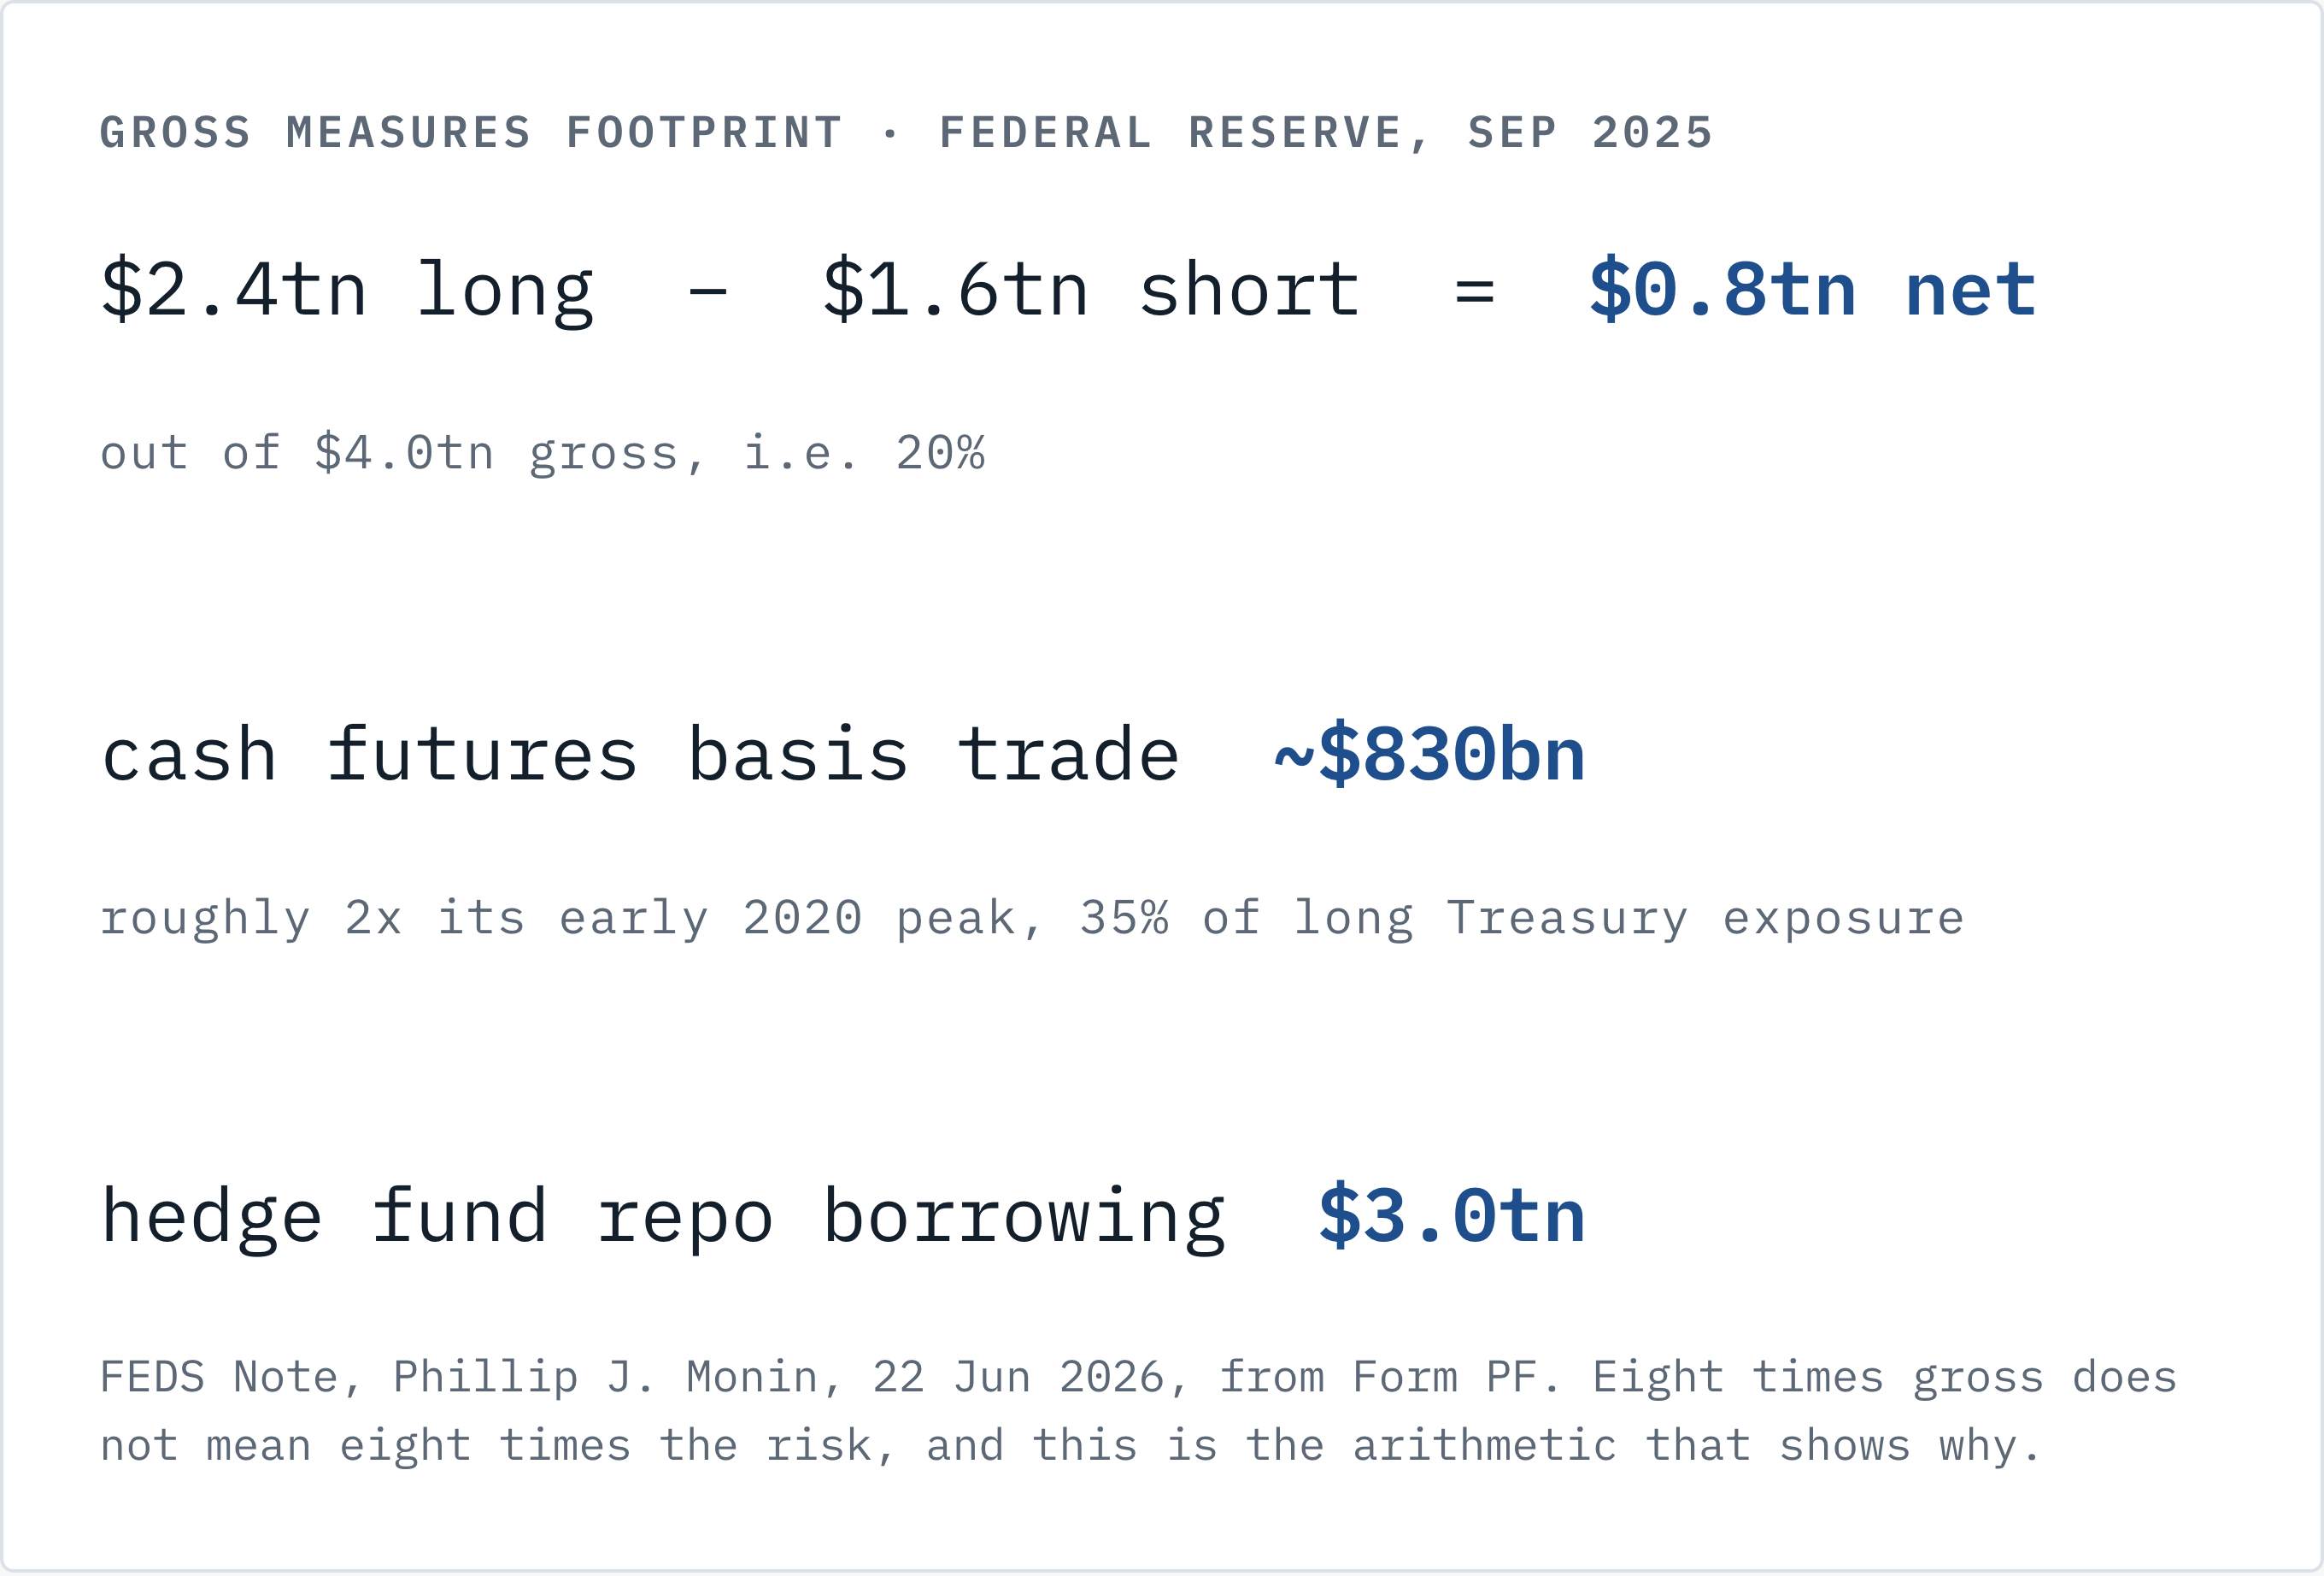
Citadel’s own balance sheet supports the steelman from the other side. KBRA reports the flagship funds hold “generally more than 30% of investment capital held in cash and cash equivalents (though the fund averaged more than 40% during 2025)”, with Level 3 positions at about 2% of the portfolio. A firm carrying 8x gross while sitting on 30% to 40% cash is not running out of rope. Those two facts belong in one sentence and almost never are.
So the steelman holds, and I’d rather concede it here than have a reader find it for me. Eight times gross does not mean eight times the risk, and anyone who tells you it does is wrong.
What I read it as is footprint. Gross assets tell you how much dealer balance sheet a firm consumes, how much repo it rolls every morning, and how much of a market it occupies when everyone reaches for the same exit. Those questions are answered by $570.6bn, and by the $331.3bn inside it. None is answered by $71bn, and $71bn is the only number most people see. Footprint and risk are different questions. The press quotes one number for both.
The capacity bound: returns fell from 38.1% to 10.2% while the industry’s gross doubled
If gross assets are the footprint, the next question is whether the footprint still buys what it used to. It doesn’t.
Wellington’s full published series runs 9.1% in 2018, 19.4%, 24%, 26%, then 38.1% in 2022, 15.3%, 15.21%, and 10.2% in 2025. I print all eight because the short version flatters my argument. 2022 was the best year in the fund’s history, and its $16bn was the largest single year profit any hedge fund had ever booked, so starting the clock there makes any subsequent path look like collapse.
The honest reading is narrower and it still holds. Returns have fallen since that peak, with 2023 and 2024 flat at just over 15%, and 2025’s 10.2% sits at the bottom of the eight year range with only 2018 below it, against 19.46% annualised since 1990. The Global Fixed Income fund, the firm’s largest book, returned 9.4% in 2025. Over that same stretch the industry was adding gross rather than shedding it: OFR data has hedge fund repo borrowing more than doubling, up 104%, between Q4 2022 and Q4 2024, and the Fed’s decomposition has the cash futures basis trade at roughly twice its early 2020 peak.
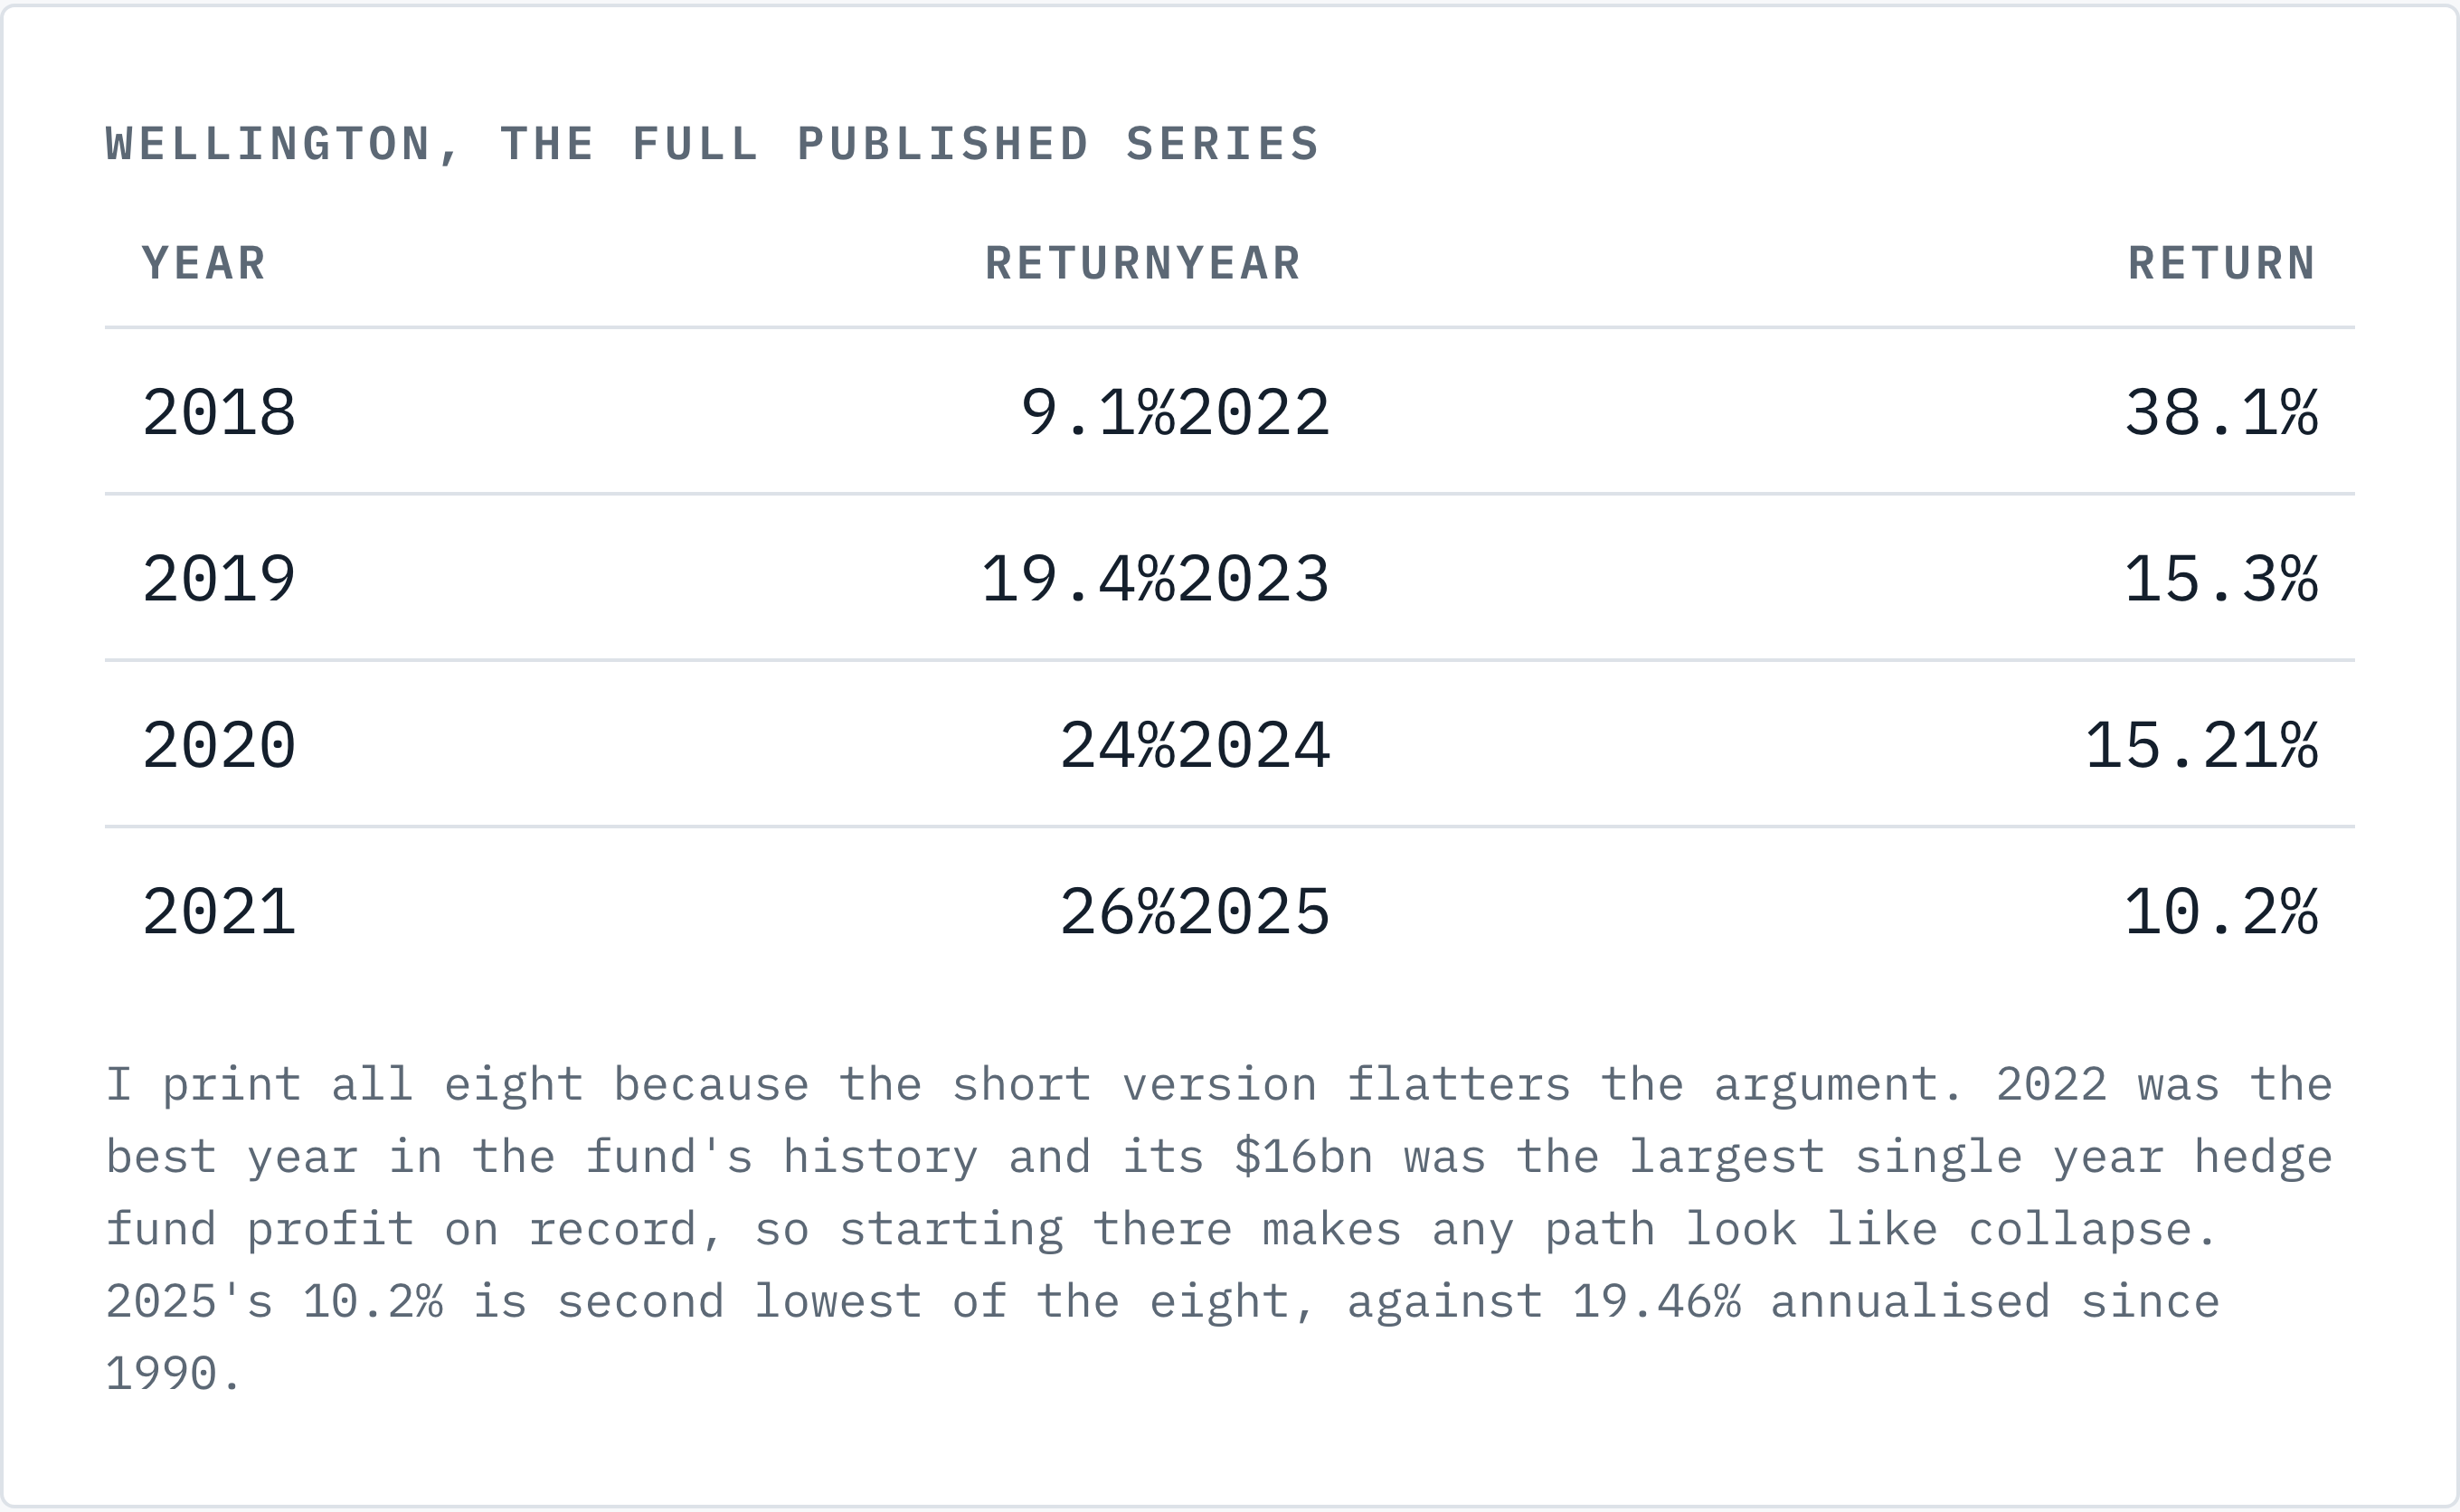
More gross, less return. I read that as capacity erosion, and it’s why I don’t read the capital returns as generosity. The binding constraint at Citadel isn’t investor demand, it’s alpha per unit of gross balance sheet, and a firm that can’t deploy another dollar profitably hands the dollar back. Griffin has said as much in the language of opportunity sets. The filings say it in the language of arithmetic.
The capital path says it arithmetically. Citadel ended 2022 with $62.3bn and stood at about $71bn on 1 July 2026, a 14% gain in three and a half years, while the portfolio earned multiples of that. The difference walked out as distributions. The money is generated. It is not retained.
A capital return works the same way from the other side. A profit distribution takes equity off the right hand side of the balance sheet and the left hand side never hears about it, so handing back $5bn leaves gross assets untouched and raises the gross to equity ratio mechanically. Same footprint, smaller cushion. A capital return is a financing decision as much as a capacity decision, and only one of those readings is ever reported.
The peer table turns this from a Citadel quirk into a strategy signature
I pulled the same Item 5.F from every large platform’s own Form ADV, because one firm’s filing proves nothing alone. A pattern shows up that no single document reveals.
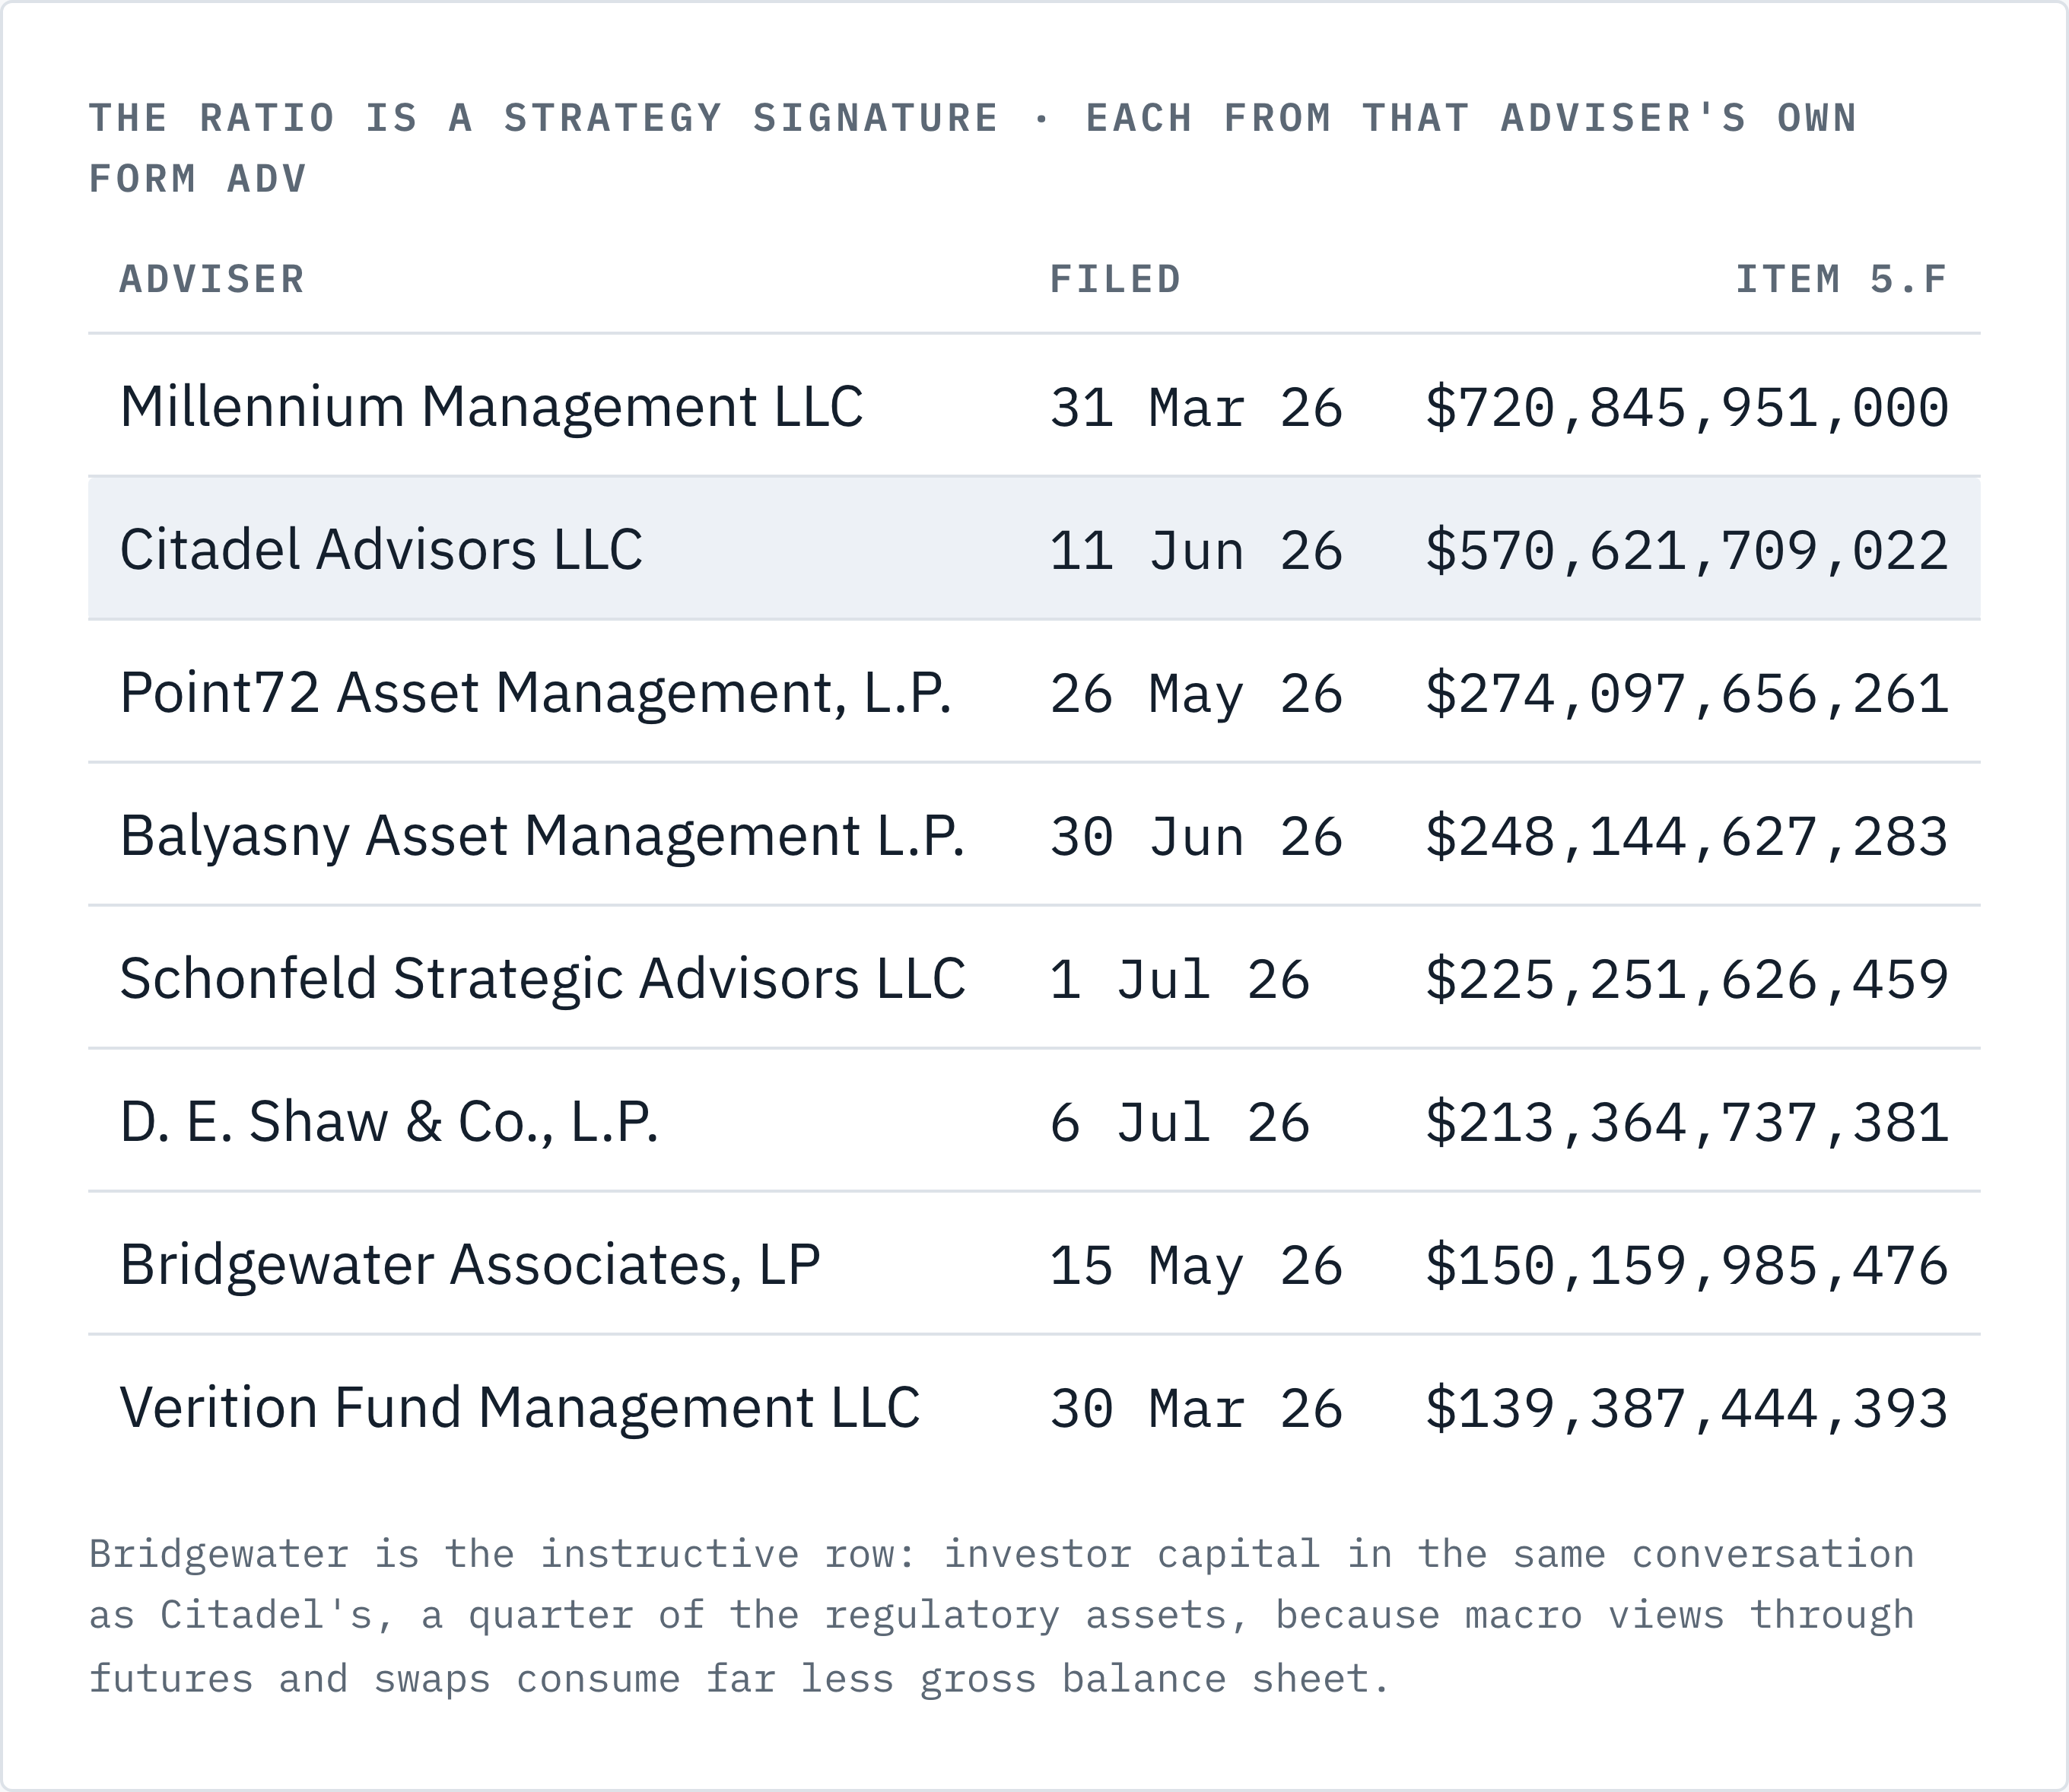
Citadel sits second, and I’d call Millennium’s $720,845,951,000 on a comparable investor base the more levered of the two. Bridgewater is the row I’d study: comparable investor capital, a quarter of the regulatory assets, because macro views expressed through futures and swaps consume far less gross balance sheet than cash against derivative relative value. The ratio is a strategy signature. Size is a different table.
One more entity deserves naming. Qube Research & Technologies Limited files as an exempt reporting adviser and reports no Item 5.F, but its Schedule D lists nine funds totalling $580,434,724,327. Add Millennium, Qube and Citadel and the three largest carry $1.87 trillion between them. That is the number these firms run on, and it is not the number they get written about with.
Three things I can’t resolve from public documents
The valuation date of Item 5.F isn’t observable. The 11 June 2026 filing is an other than annual amendment, and Item 5.F need only be updated annually, so the computation may date from the last annual one. I tried the SEC’s historical ADV compilation feeds and they refuse automated access. A separate fetch on 11 August returned an identical $570,621,709,022, which tells me the figure is stable and nothing about when it was struck.
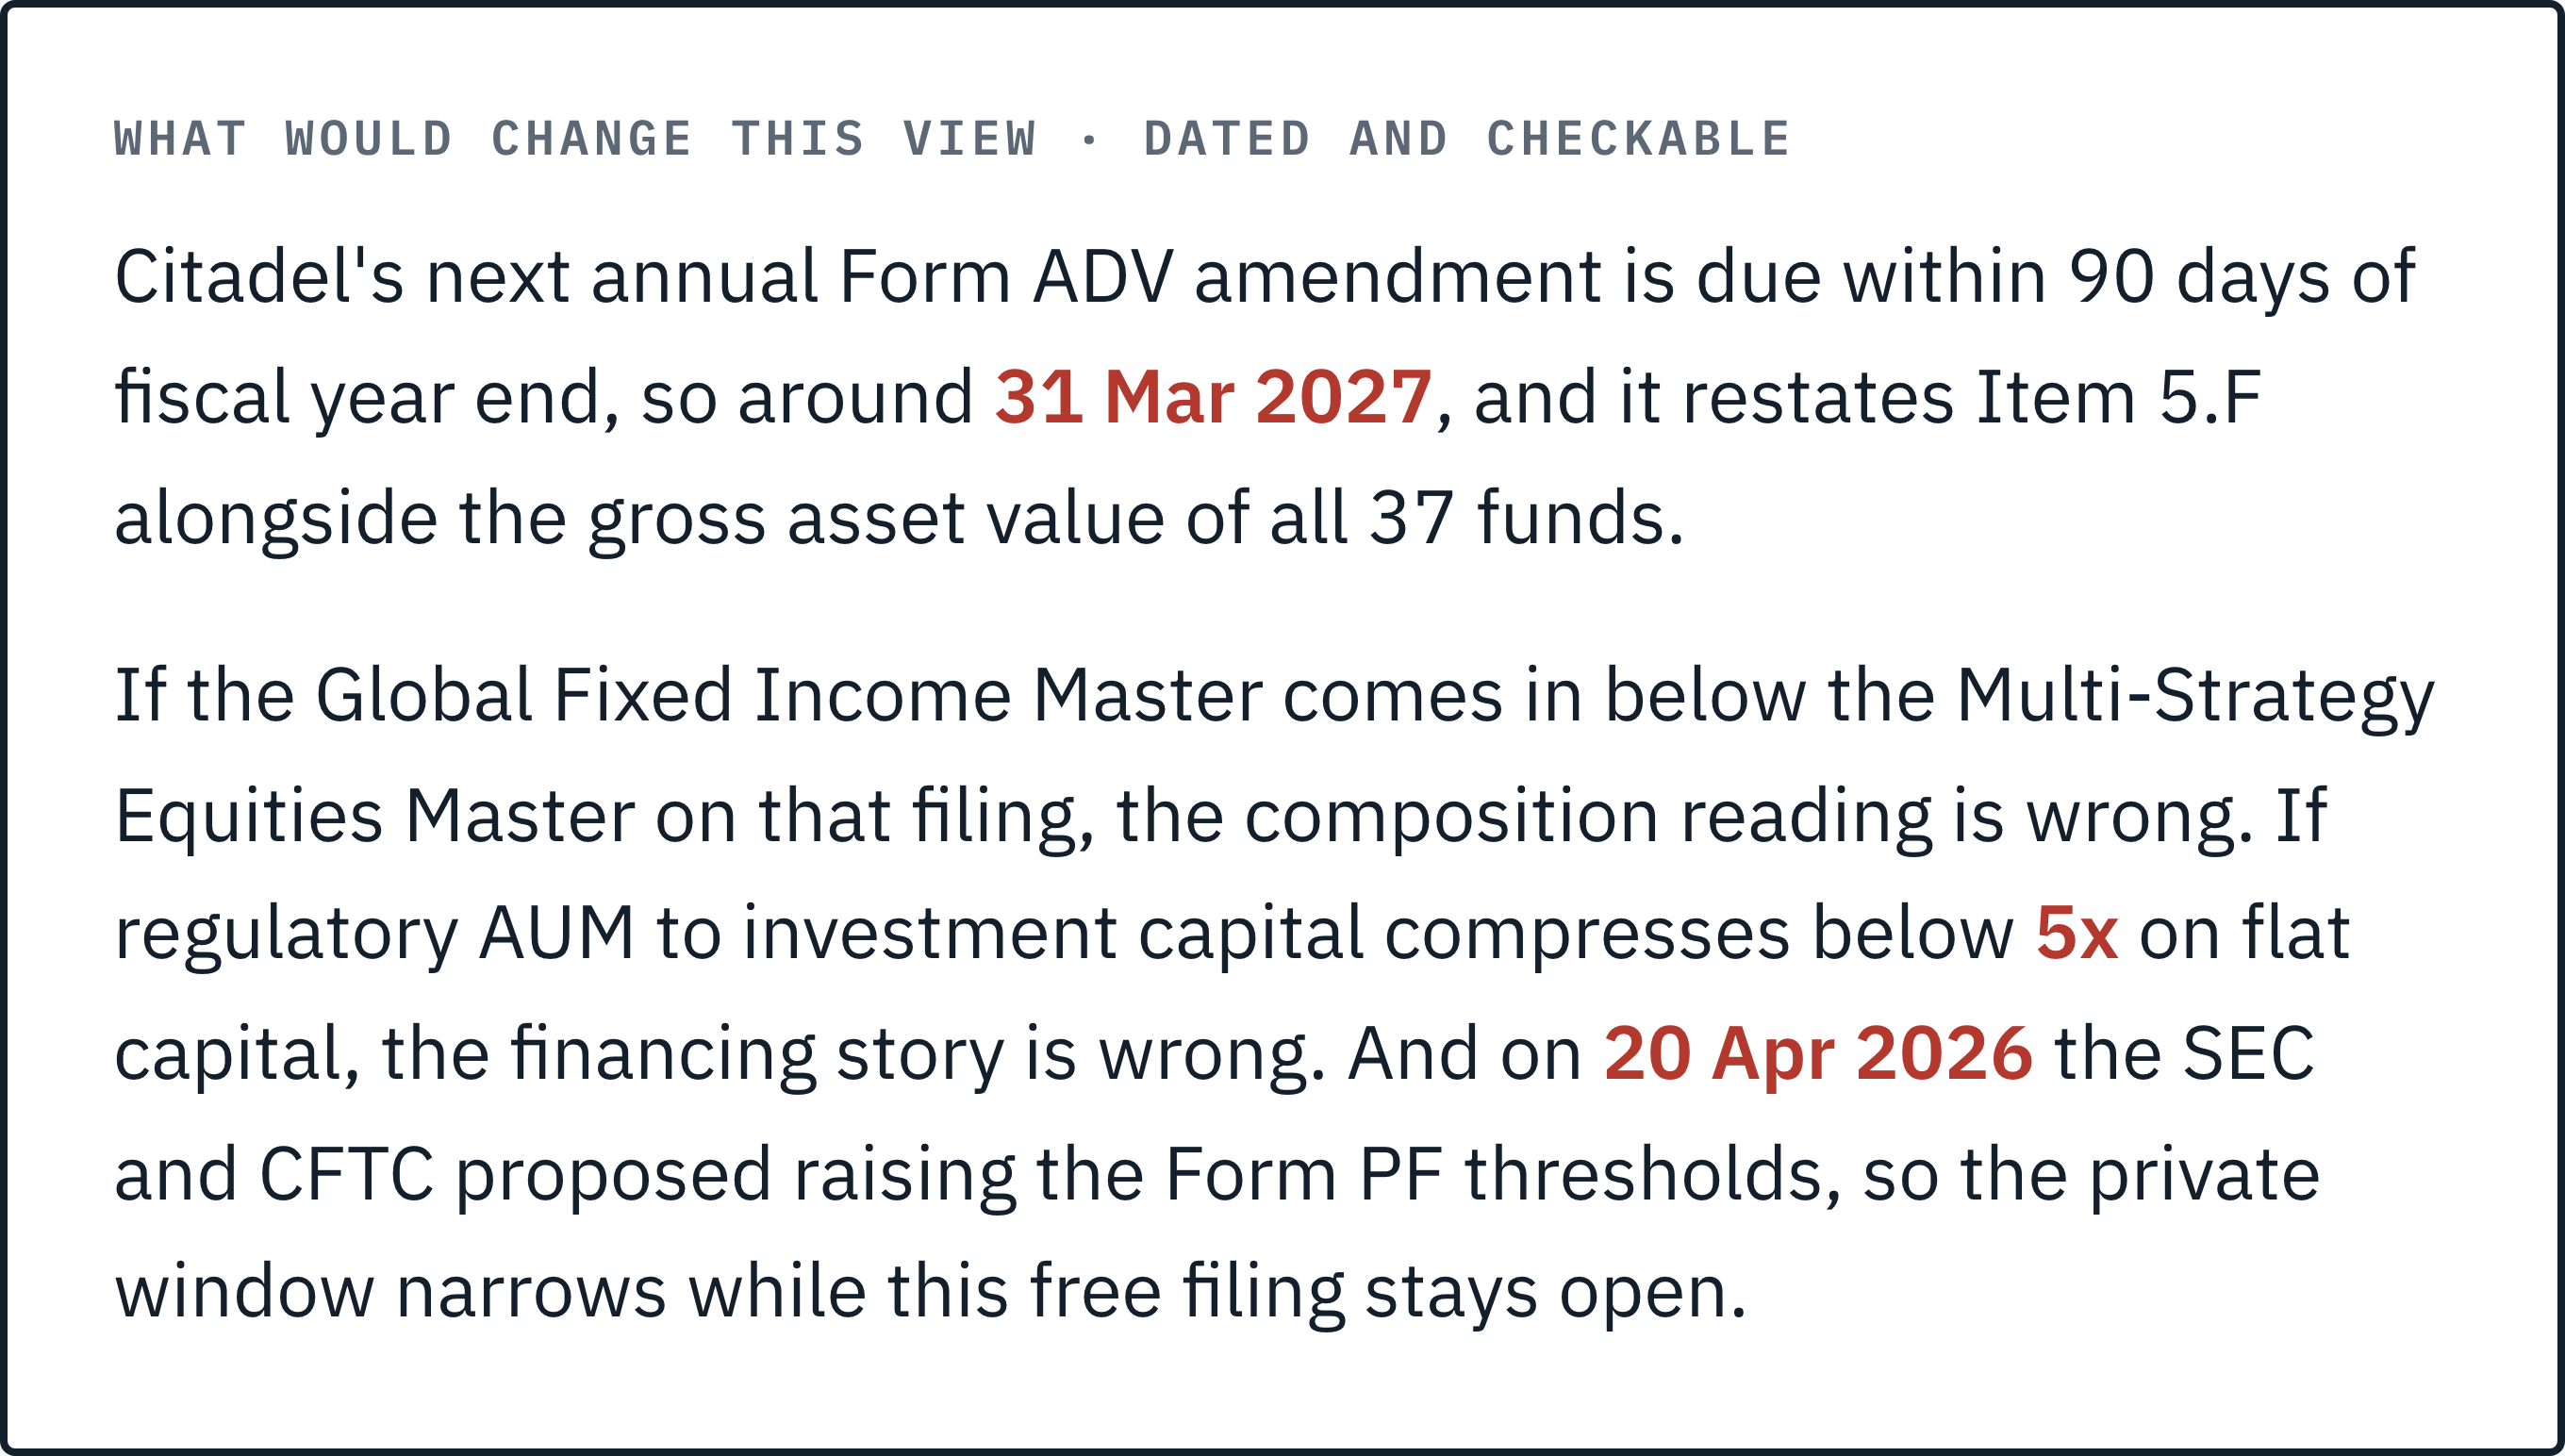
Gross asset value isn’t net asset value, and Form PF isn’t public. Schedule D asks for gross assets. The borrowings, the repo, the derivative notionals and the actual net exposures all live in Form PF, which the SEC collects and doesn’t publish at firm level. Everything I’ve said about Citadel’s financing is inferred from the gap between two published numbers. None of it is read off a liability schedule. And that private window is narrowing: on 20 April 2026 the SEC and CFTC jointly proposed lifting the Form PF filing threshold from $150m to $1bn, and the large hedge fund adviser threshold from $1.5bn to $10bn. Fewer filers, less collected. Which makes the free filing I have been reading from more load bearing, not less.
The 13F comparison is the weakest of the four, and I’d never use it as a portfolio figure. The Q4 2025 filing reported $665,872,168,045 across 15,403 positions, so it swings by tens of billions a quarter for reasons with little to do with the hedge fund.
What would change my view: the annual amendment due March 2027
My composition claim is the most exposed, so here is its test, stated precisely.
Citadel’s next annual Form ADV amendment is due within 90 days of its fiscal year end and restates Item 5.F alongside all 37 fund gross asset values. If the Global Fixed Income Master’s gross assets come in below the Multi-Strategy Equities Master’s on that filing, my reading that this is a rates balance sheet with an equities business attached is wrong, and I’ll say so here. If total regulatory AUM to investment capital compresses below 5x while capital is flat, the financing story is wrong. And if a future FEDS Note shows the industry’s net to gross Treasury ratio climbing well above 20%, the footprint claim weakens, because gross and net would be converging.
Nearer term, the Q2 2026 13F is due 14 August. I expect the table value to jump on the Situational Awareness purchase, and I expect that jump to tell you almost nothing about the firm. Which is rather the point.
$71bn for returns, $570.6bn for counterparty risk
Here’s the rule I’d apply, one line each.
Underwriting Citadel’s returns or its fee load? Use $71 billion. That’s the equity performance is struck on, and the honest denominator.
Underwriting Citadel as a counterparty, a repo borrower, a crowding risk, or a competitor in trades you’re in? Use $570.6 billion, and look inside it at the $331.3 billion. That’s the balance sheet you’re standing next to.
Reading a 13F headline about Citadel’s “portfolio”? Discount it hard. Long only, US listed, market maker inside.
The habit generalises better than the case, and it’s the part I’d keep. When you see a firm’s size quoted, ask which filing it came from and which question that filing was built to answer. Across every platform I pulled, the answer moves by a factor of five to fifteen. The filings are free. Almost nobody opens them.
The whole procedure is in the accompanying note: six steps, the eight adviser dataset, the three places it breaks. On the financing side I took apart how hedge funds trade the $30 trillion Treasury market, and before that how Millennium, Citadel and Point72 structure their pods. I publish this filing work as research on Patreon, for people underwriting a counterparty rather than reading about one. Shorter reads go up on LinkedIn, filmed versions on YouTube.
So here’s my question for anyone allocating to this space. When your risk team sizes counterparty and crowding exposure to one of these platforms, do they use the investor capital figure or the Item 5.F figure, and if it’s the former, what’s the argument for it?
Cover photograph: J. Crocker, Attribution, via Wikimedia Commons.