


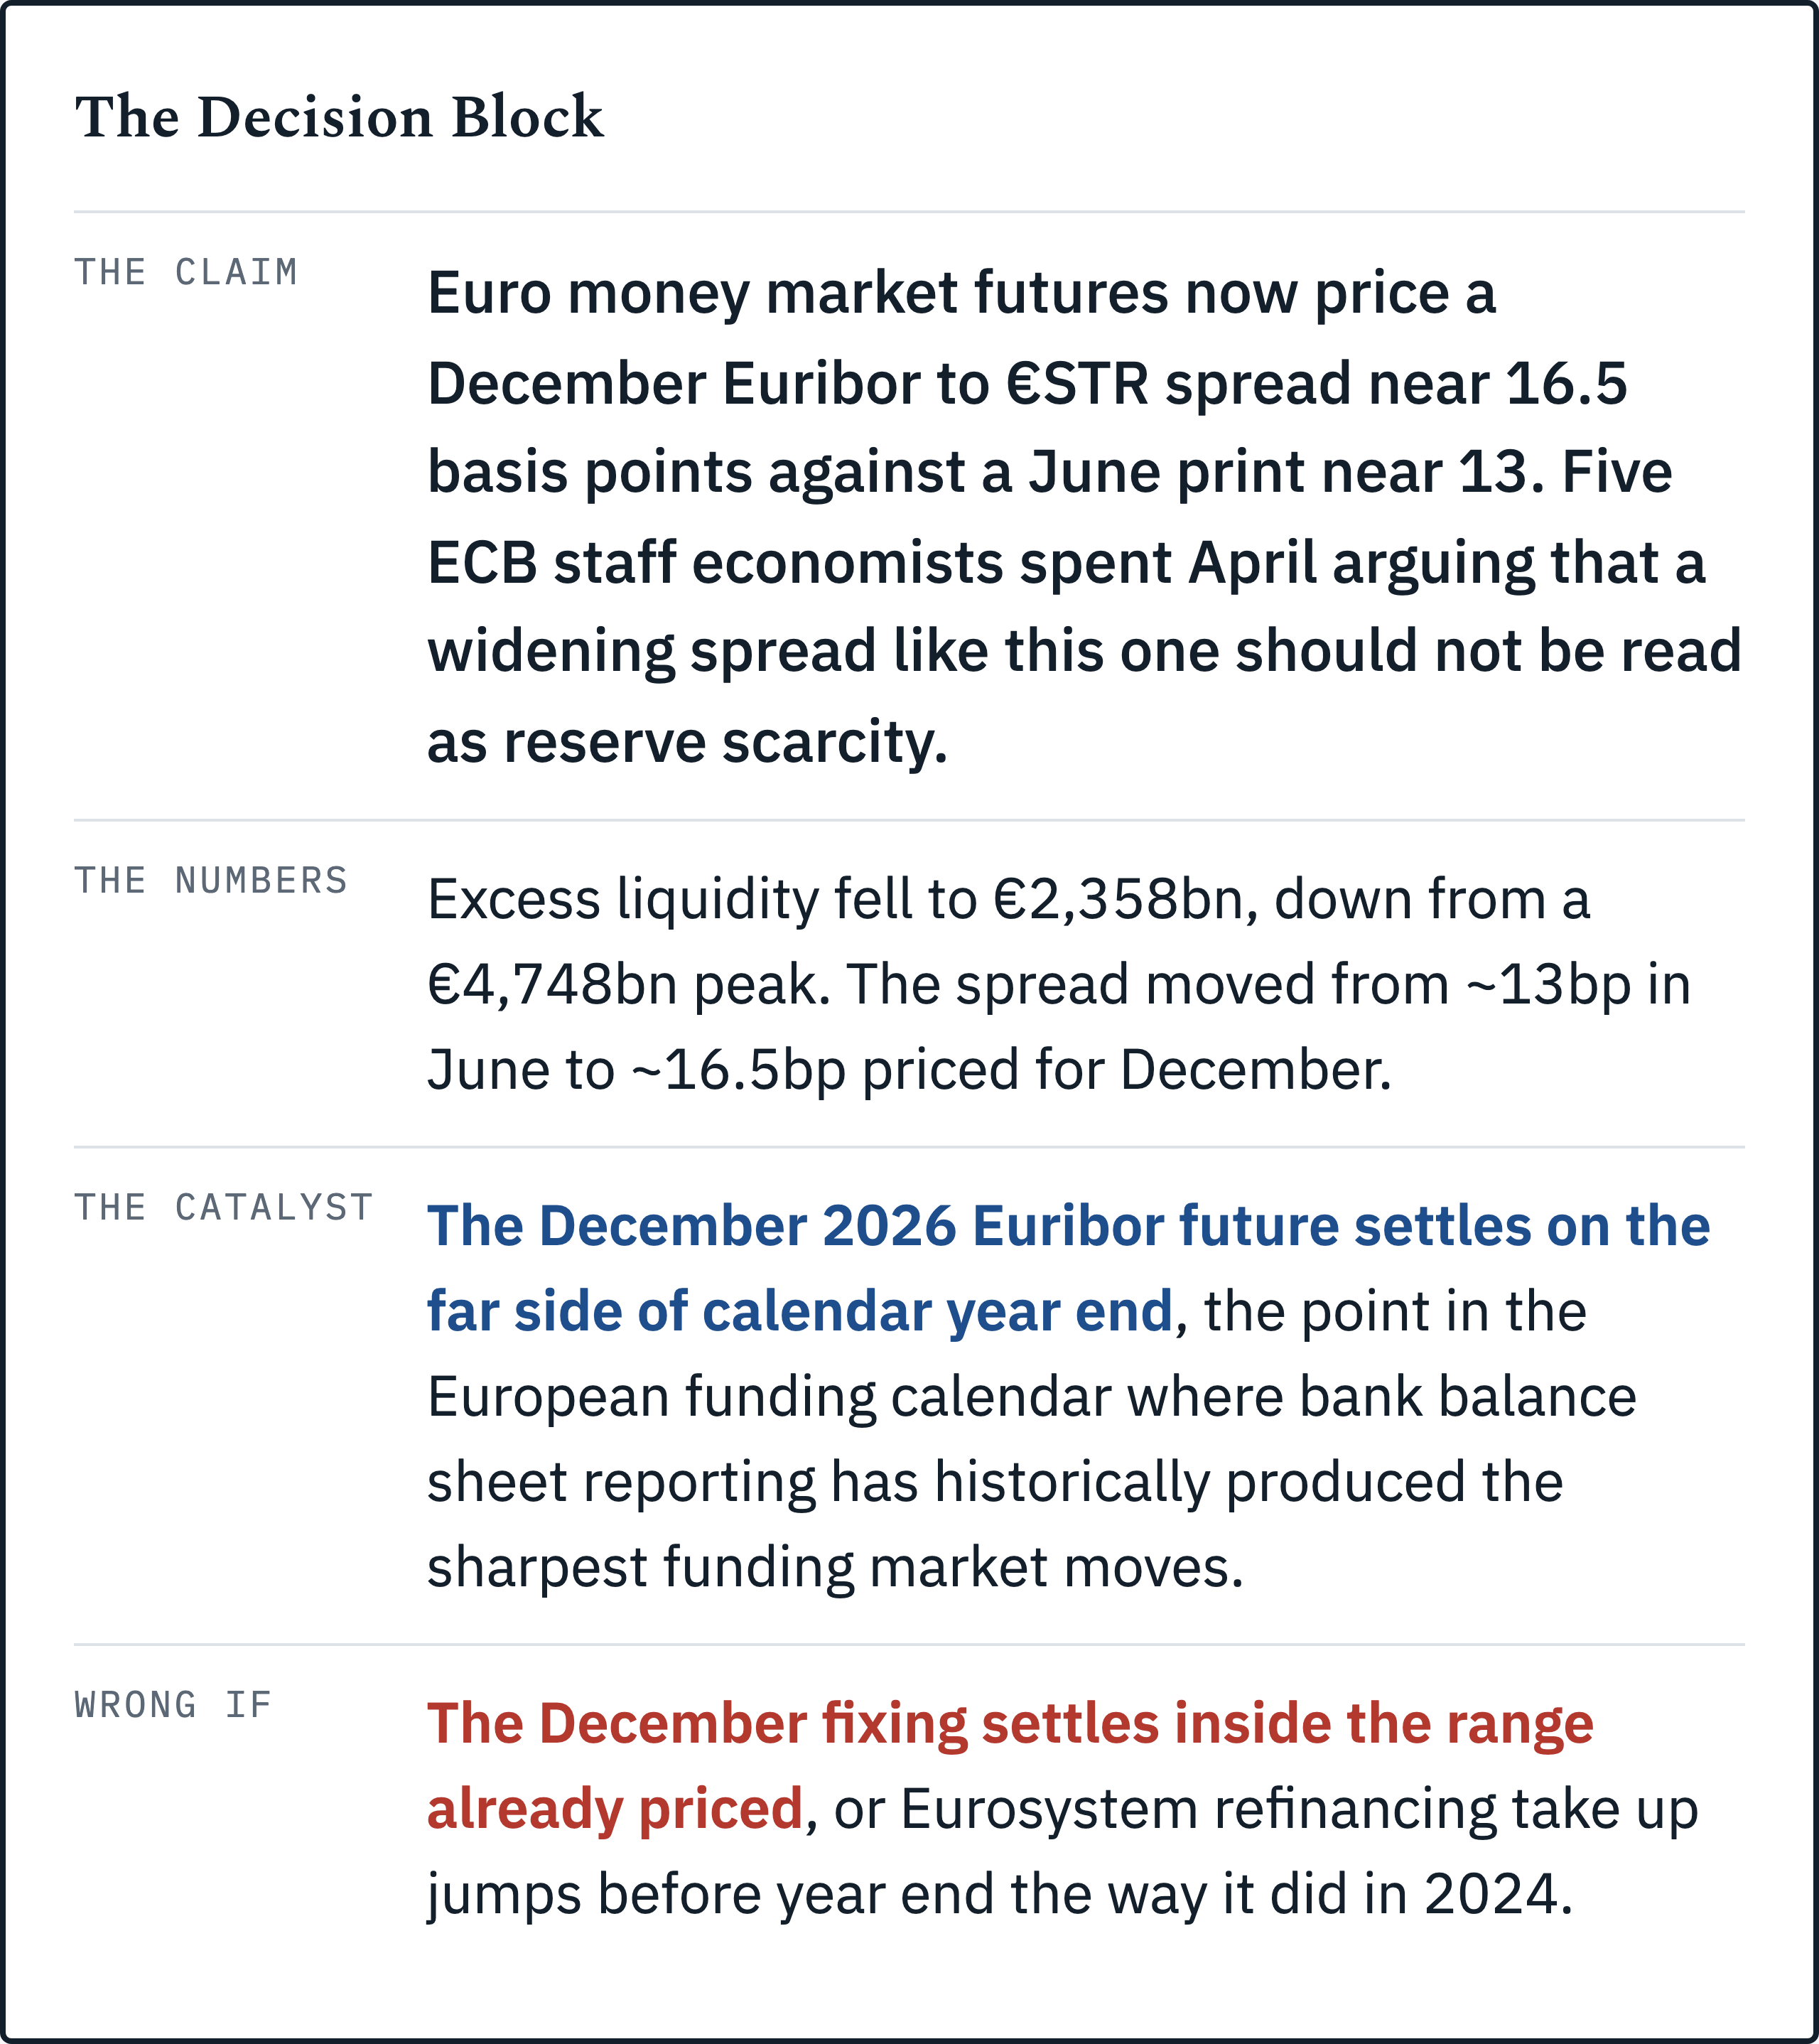
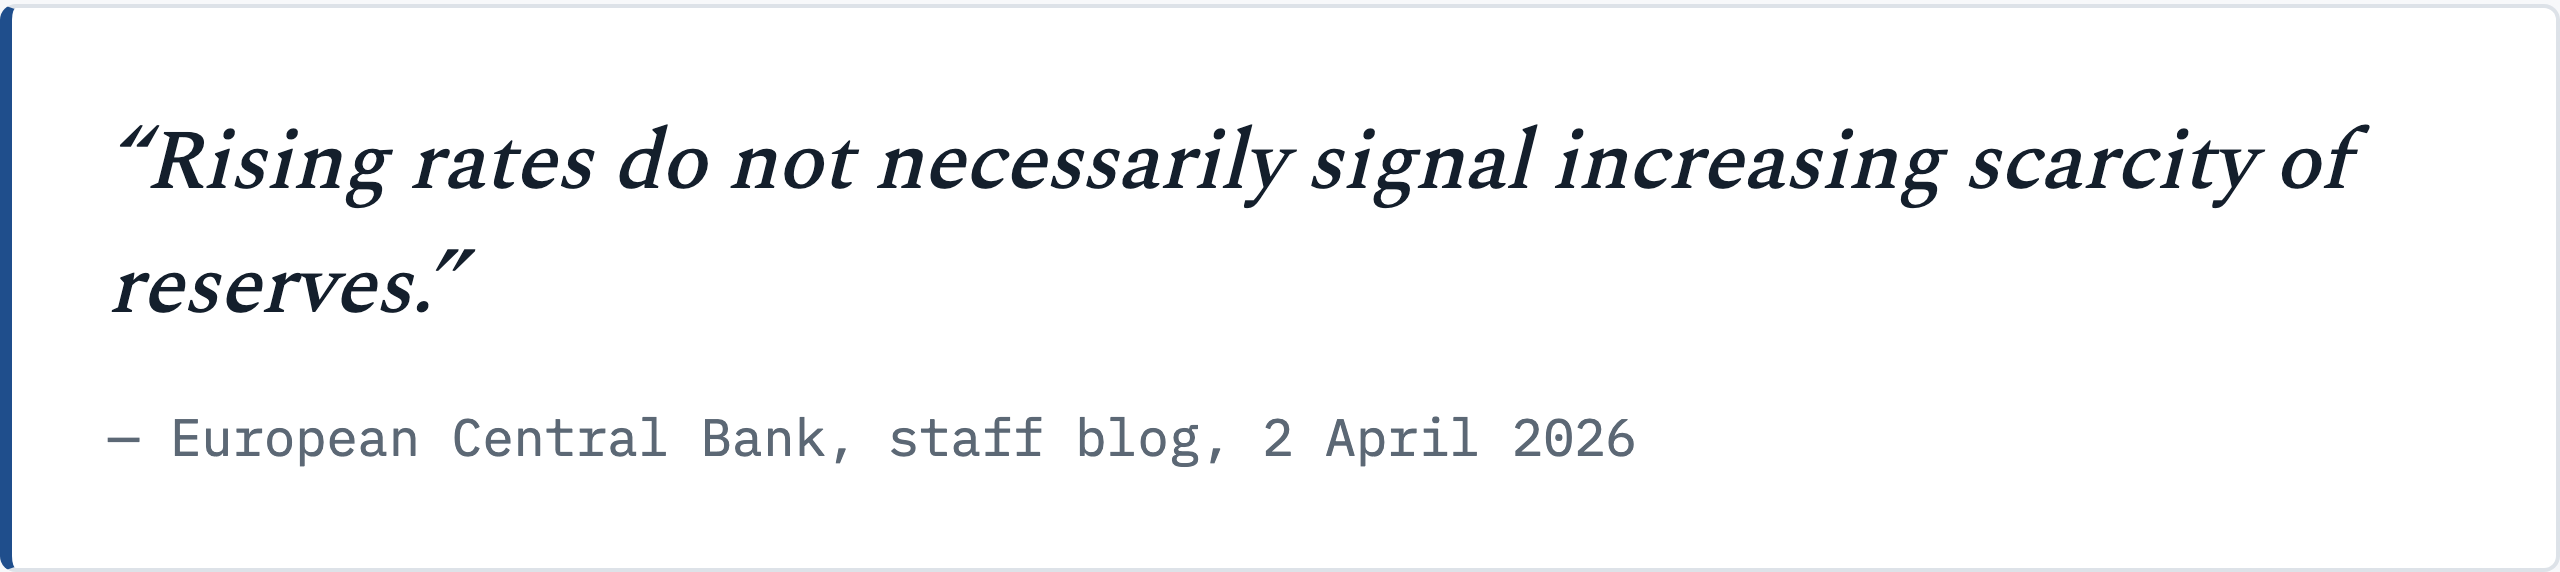
Citadel and Schonfeld Strategic Advisors are reportedly running a trade that, on the ECB’s own telling, sounds like a bet on nothing. Bloomberg reported on 10 September 2026, citing people familiar with the matter, that both firms are active in it. In April, five ECB staff economists published a blog post walking through the exact phenomenon this trade prices, and their conclusion was that rising money market spreads “do not necessarily signal increasing scarcity of reserves” and “may not provide a reliable signal about the overall liquidity environment.” That’s a central bank publicly warning against misreading the thing two large funds are reportedly positioned on.
I want to take the ECB’s case seriously before I depart from it. It’s a good argument, and it isn’t the one I expected to find when I opened this research.
The ECB says the transition is orderly
The ECB’s case is specific and it’s recent. Central bank reserves have “almost halved from a peak of €4.9 trillion in 2022 to €2.6 trillion in early 2026,” and the euro area financial system “has so far adjusted well to declining reserves.” There are, in the ECB’s own words, no signs of fragmentation. No cracks yet. Short term rates, secured and unsecured both, sit close to the deposit facility rate. The spread between the euro short term rate, €STR, and the deposit facility rate has narrowed this year: 6.8bp below the DFR in the most recent reserve maintenance periods, against 7.0bp in the two before that, per the ECB’s own Economic Bulletin. I read that as the strongest single data point the ECB has for its own case.
One data point does look odd, and the ECB names it itself: 40% of overnight repo trades now execute above the deposit facility rate. Their read is that this doesn’t reflect bank funding pressure at all. Banks with thinner reserve cushions are still borrowing below the DFR on average. The trades above it are mostly hedge funds paying up for cash to fund positions elsewhere.
That’s the strongest form of the consensus I can build. Reserves are still abundant. The transition is orderly. A clean story. A trader reading a widening spread as scarcity is making a category error the ECB addressed in print, in advance, five weeks before this trade made the news. I have to grade that as a real point against my own thesis.
Two mechanisms, and the market is pricing the one the ECB didn’t write about
Here’s the observation that forces a different reading. The ECB’s blog describes the steady state relationship between the aggregate reserve level and money market rates. It never once mentions the calendar. And the calendar is exactly where the Euribor to €STR futures curve prices its widening: December, not June, not any ordinary month between them.
That gap, between what the ECB’s model covers and what the futures curve prices, is a disagreement about mechanism: which force actually produces a euro money market spike. My read is that the ECB’s April post answers a question about the LEVEL of reserves, and the futures curve is pricing a question about the CALENDAR.
An independent industry body that works alongside the Eurosystem’s own market groups names the calendar driver directly. The International Capital Market Association’s European Repo and Collateral Council put it plainly in its January 2025 year end review: the euro year end effect is driven mainly by bank balance sheet scarcity. G-SIB scores. Leverage ratio limits. Capital and liquidity requirements. Stress testing. Bank levies in some jurisdictions. All of it pushes banks to shrink their balance sheets specifically at the calendar year end, and repo books are usually the first thing cut. An easy target.
A regulatory reporting effect, dated to one balance sheet snapshot, sitting on top of whatever the aggregate reserve level happens to be that year. It can fire when reserves are comfortable. It can stay quiet when reserves are tight. Different triggers. The two mechanisms move together most of the time, which is exactly why they get treated as one. They aren’t. A trade priced on the December contract is a trade on the second mechanism, the one the ECB’s April post never addressed.
How €4.7 trillion in excess liquidity closed this basis
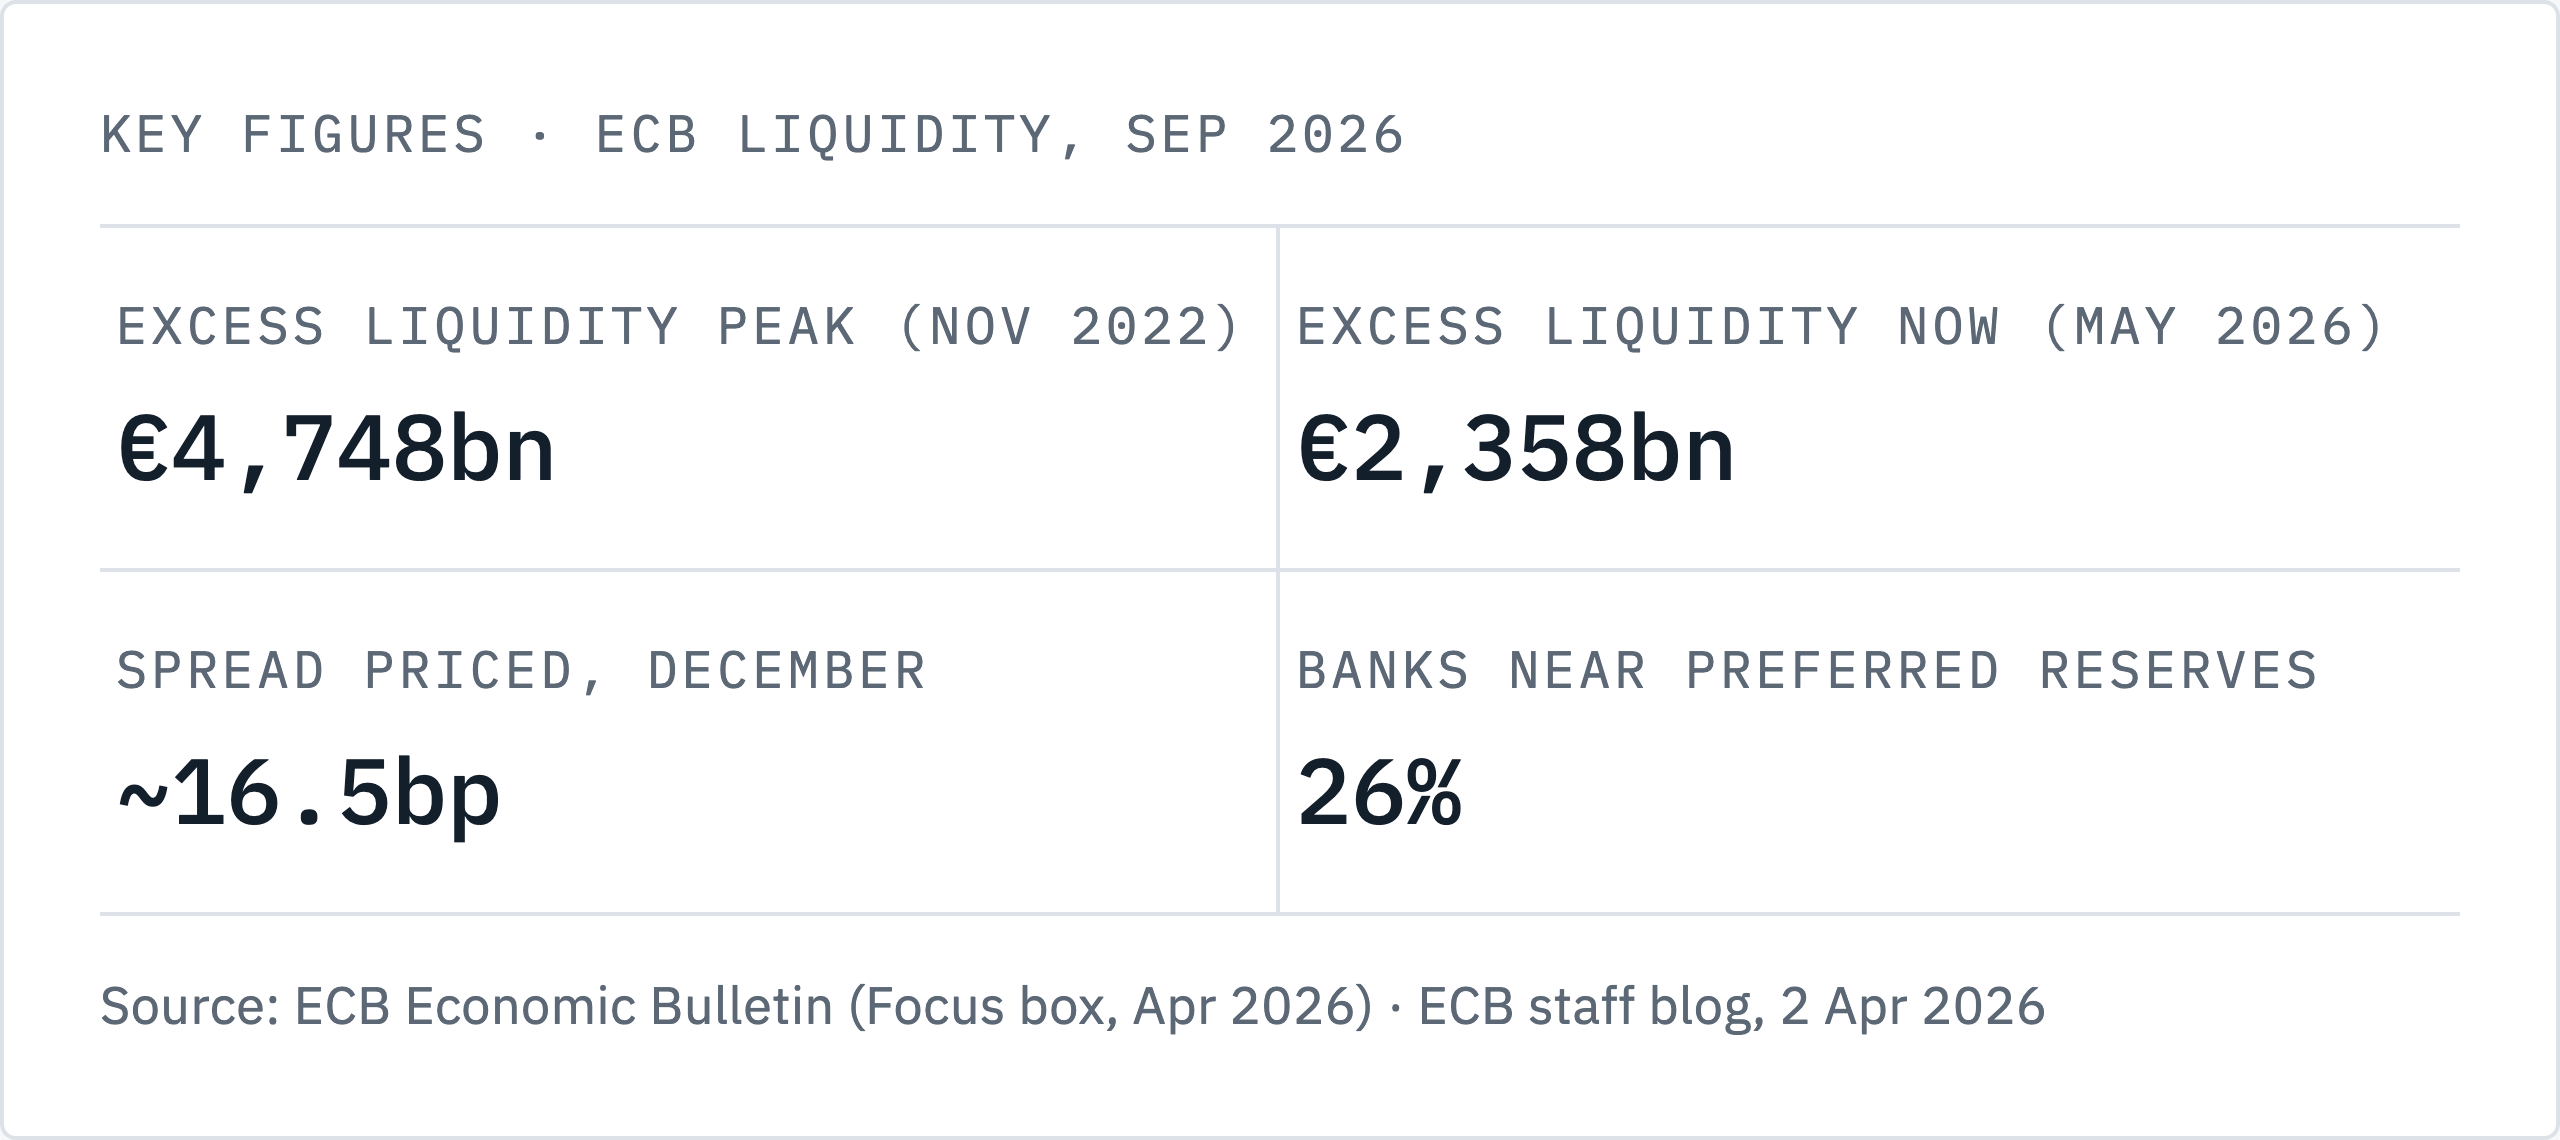
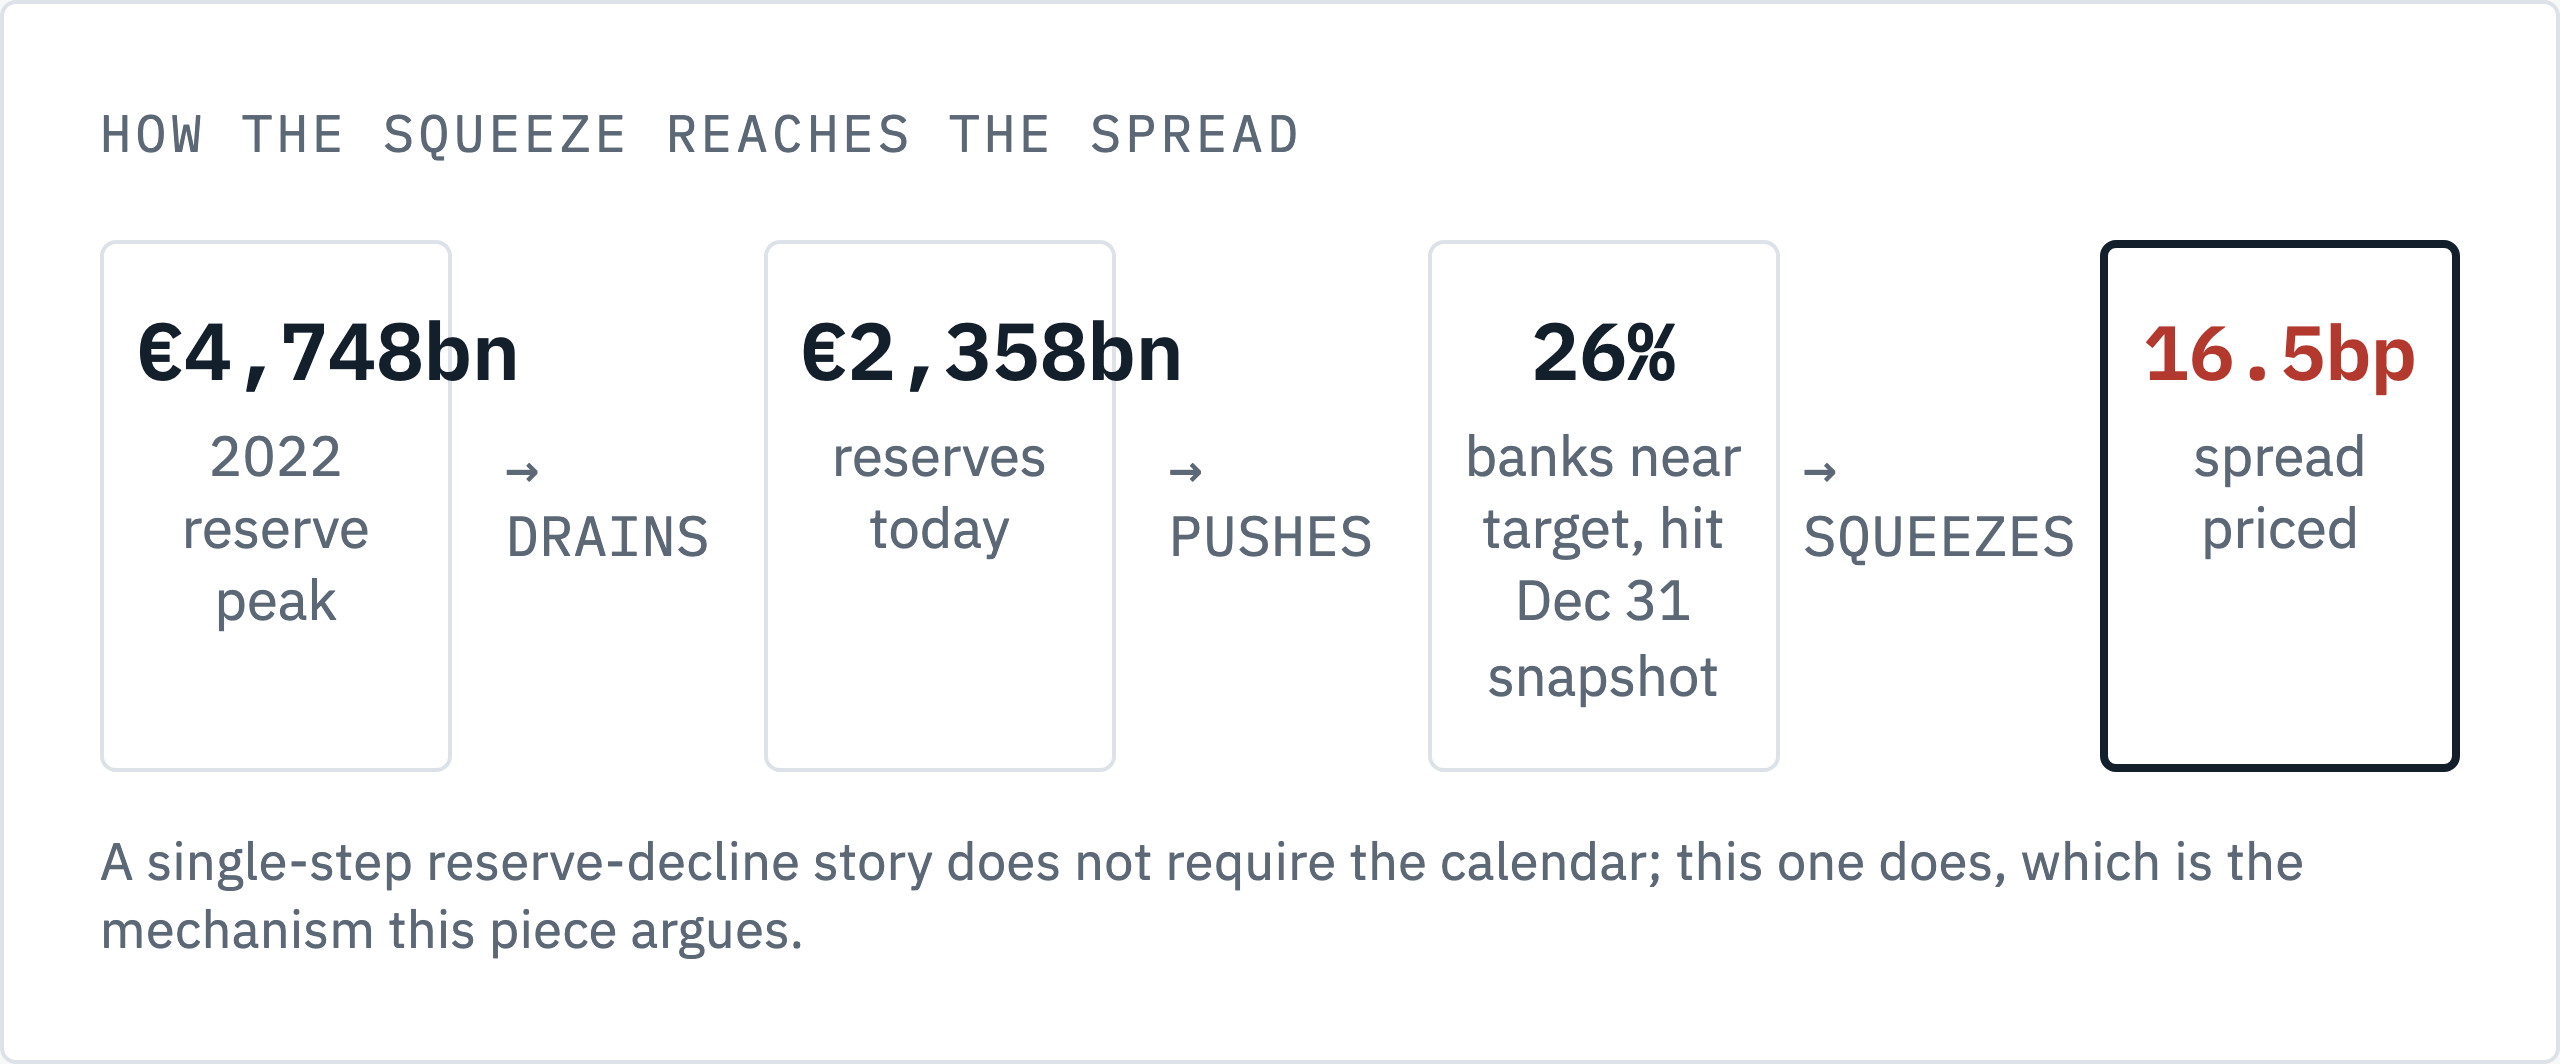
One term note before the arithmetic: the ECB uses “reserves” and “excess liquidity” as two related but distinct measures. Reserves ran €4.9 trillion at the 2022 peak and €2.6 trillion in early 2026; excess liquidity, the narrower figure this piece tracks most closely because it is what the futures market actually prices against, peaked at €4,748 billion and sits at €2,358 billion as of May. The gap between the two is roughly the €172 billion euro area banks must hold as minimum reserves. I use excess liquidity throughout unless I say otherwise.
Start with what Euribor and €STR actually measure, because the spread between them is the whole trade. €STR is overnight: the volume weighted average cost of unsecured overnight borrowing among euro area banks, published daily by the ECB itself. Three month Euribor is a term rate, a panel bank estimate of where unsecured interbank lending clears three months forward. In principle three month Euribor should track the market’s expected path of €STR over that window, plus a small premium for locking money up for ninety days instead of one day.
For most of the period since 2022, that premium sat close to zero. Banks were flooded with reserves. Nobody needed to bid aggressively for three month money when overnight funding was already abundant and cheap. That near zero premium is exactly what quantitative tightening is now unwinding. As the ECB lets its bond holdings under the APP and PEPP mature without reinvestment, excess liquidity has come down €2,390 billion from the 2022 peak, and the cushion that kept term funding cheap relative to overnight funding gets thinner every quarter.
The ECB’s own bank treasurer survey shows this happening bank by bank, not just in the aggregate. Banks representing 26% of euro area banking assets sat close to their internally preferred reserve level as of the Q4 2025 reading, up from 15% a year earlier, and the ECB projects that share hitting 50% by the end of 2026, a pace that has to accelerate from the trailing 11 points a year to clear 24 more points in roughly twelve months. A bank near its own target starts caring where it sources three month money versus overnight money in a way it didn’t two years ago, because term funding also carries regulatory value: the liquidity coverage ratio and the net stable funding ratio both reward longer tenors, and the survey shows banks defending internal targets set above the regulatory minimum. Their own cushion, not the rulebook’s.
Add the calendar and a second mechanism switches on
LCR, NSFR, the leverage ratio, G-SIB systemic scores: every one of those gets measured against a balance sheet snapshot at 31 December. ICMA calls 2016 the worst EUR REPO turn on its own ten year record, a “perfect storm” of bond market positioning, a shortage of high quality collateral and onshore/offshore dollar imbalances that practically closed the market. That is a claim about the secured repo market specifically, one that runs on collateral, and it predates most of the regulatory ratios that now drive the unsecured effect this piece is about.
The unsecured precedent runs older still. I checked that the 2007 turn was serious enough that the ECB itself intervened directly in the interbank market, reinforcing its allotment policy and stretching a mid December refinancing operation to a two week maturity specifically to bridge Christmas and the turn in one operation. I could not independently verify a precise basis point figure for that jump against a primary source I trust, so I am not going to quote one. The ECB’s own emergency response is evidence enough that the mechanism is real and older than the rules that now formalize it.
A three month Euribor contract settling in December prices the risk that banks pull back from term lending exactly when regulatory reporting makes balance sheet space most expensive. A €STR future, an overnight rate, carries none of that seasonal weight. Nothing to bridge. The spread between them is where the secular decline in reserves and the cyclical balance sheet squeeze actually meet, and it’s the only instrument I know of that isolates the second effect from the first.
This isn’t a new trade either. MNI Markets, an independent fixed income wire with no connection to Bloomberg’s September reporting, recorded elevated volume in this exact spread on 31 July 2024, trading at 10.75 basis points against the March 2025 Euribor contract, on volume its own desk described as running two to four times what the other contract months traded that same session. Desks were running this position more than a year before it made the news. Ahead of the story, not behind it.
Below the paid line:
- The full ECB rate and liquidity table (€2,353 billion deposit facility recourse, €172 billion minimum reserves, €24 billion in MRO/LTRO usage) worked against the reserve scarcity threshold the bank treasurer survey implies
- The exact ICE contract construction a euro rates desk uses to hold this spread into December, sized against its 106,910 lot open interest record and its 90%-plus margin offset versus Euribor
- The 2024 AND 2025 near misses worked in full, with the specific ICMA sourced reasons the priced spike deflated both times, and the secured versus unsecured distinction the thesis actually rests on
- The reflexivity problem, worked through against the 40% above-DFR repo share the ECB itself attributes to hedge fund cash demand
- The 31 December to 2 January settlement window and the exact basis point level that proves this trade right or wrong
The year it failed twice, and the one distinction I can defend
Here’s the counterargument a sophisticated reader reaches immediately: the market has priced a year end blowout before and gotten it wrong. Twice, in fact, and I owe you both.
2024 first. ICMA’s own account says the spread began pricing “a significant premium to benchmark rates, rather than the usual deep discount” starting in October 2024, driven by a September quarter end repo spike and swelling prime brokerage demand after the US election that November. By December the pressure eased. Funding had already been locked in early. The USD FX basis stayed near zero. Hedge funds actually deleveraged and unwound long basis positions into the turn. A sharp equity selloff in December took pressure off the largest banks’ balance sheets right when it mattered most. ICMA’s own verdict: the 2024 year end was “certainly interesting, but ultimately uneventful,” and in its own retrospective judgment, “possibly the least eventful in recent history.”
2025 is the one I have to add, and it is the harder case. ICMA’s January 2026 year end note says the 2025 turn “largely mirrored that of 2024,” under reserves that had fallen further still. The market again priced “a reasonable premium” into the fourth quarter, and that premium again “steadily eroded” as the date approached, helped along by a strong equity rally easing prime broker balance sheet strain, a EUR/GBP FX basis sitting close to zero, and the availability of the ECB’s own repo facilities as a ceiling on rates. Two years running, a smaller cushion each time, and no spike either year. Zero for two.
I have to name the one distinction I can actually defend, because “the cushion is smaller this time” is not enough on its own after two misses. ICMA’s own reports are about the repo market: secured borrowing against collateral. Since 2024, quantitative tightening has been pushing more government bonds into the market at the same time it drains reserves, so collateral has gotten more abundant even as cash has gotten scarcer. ICMA’s 2025 note says exactly this: the year end paradigm has “shifted from one of surplus reserves and potential collateral scarcity to that of more traditional funding pressures,” with the balance sheet squeeze real but “less distortive” than feared, partly because dealers had ample collateral to work with.
This trade is not on repo. It is on Euribor against €STR, both unsecured. No amount of extra government bond supply makes unsecured interbank credit any easier to extend at year end. That is a genuine structural difference between the market ICMA has now watched fail to spike twice and the market this contract prices. It is not a proof. I have no clean year end test of the unsecured market for 2024 or 2025 to check it against, and I am naming that gap rather than papering over it. An honest hole, not a footnote.
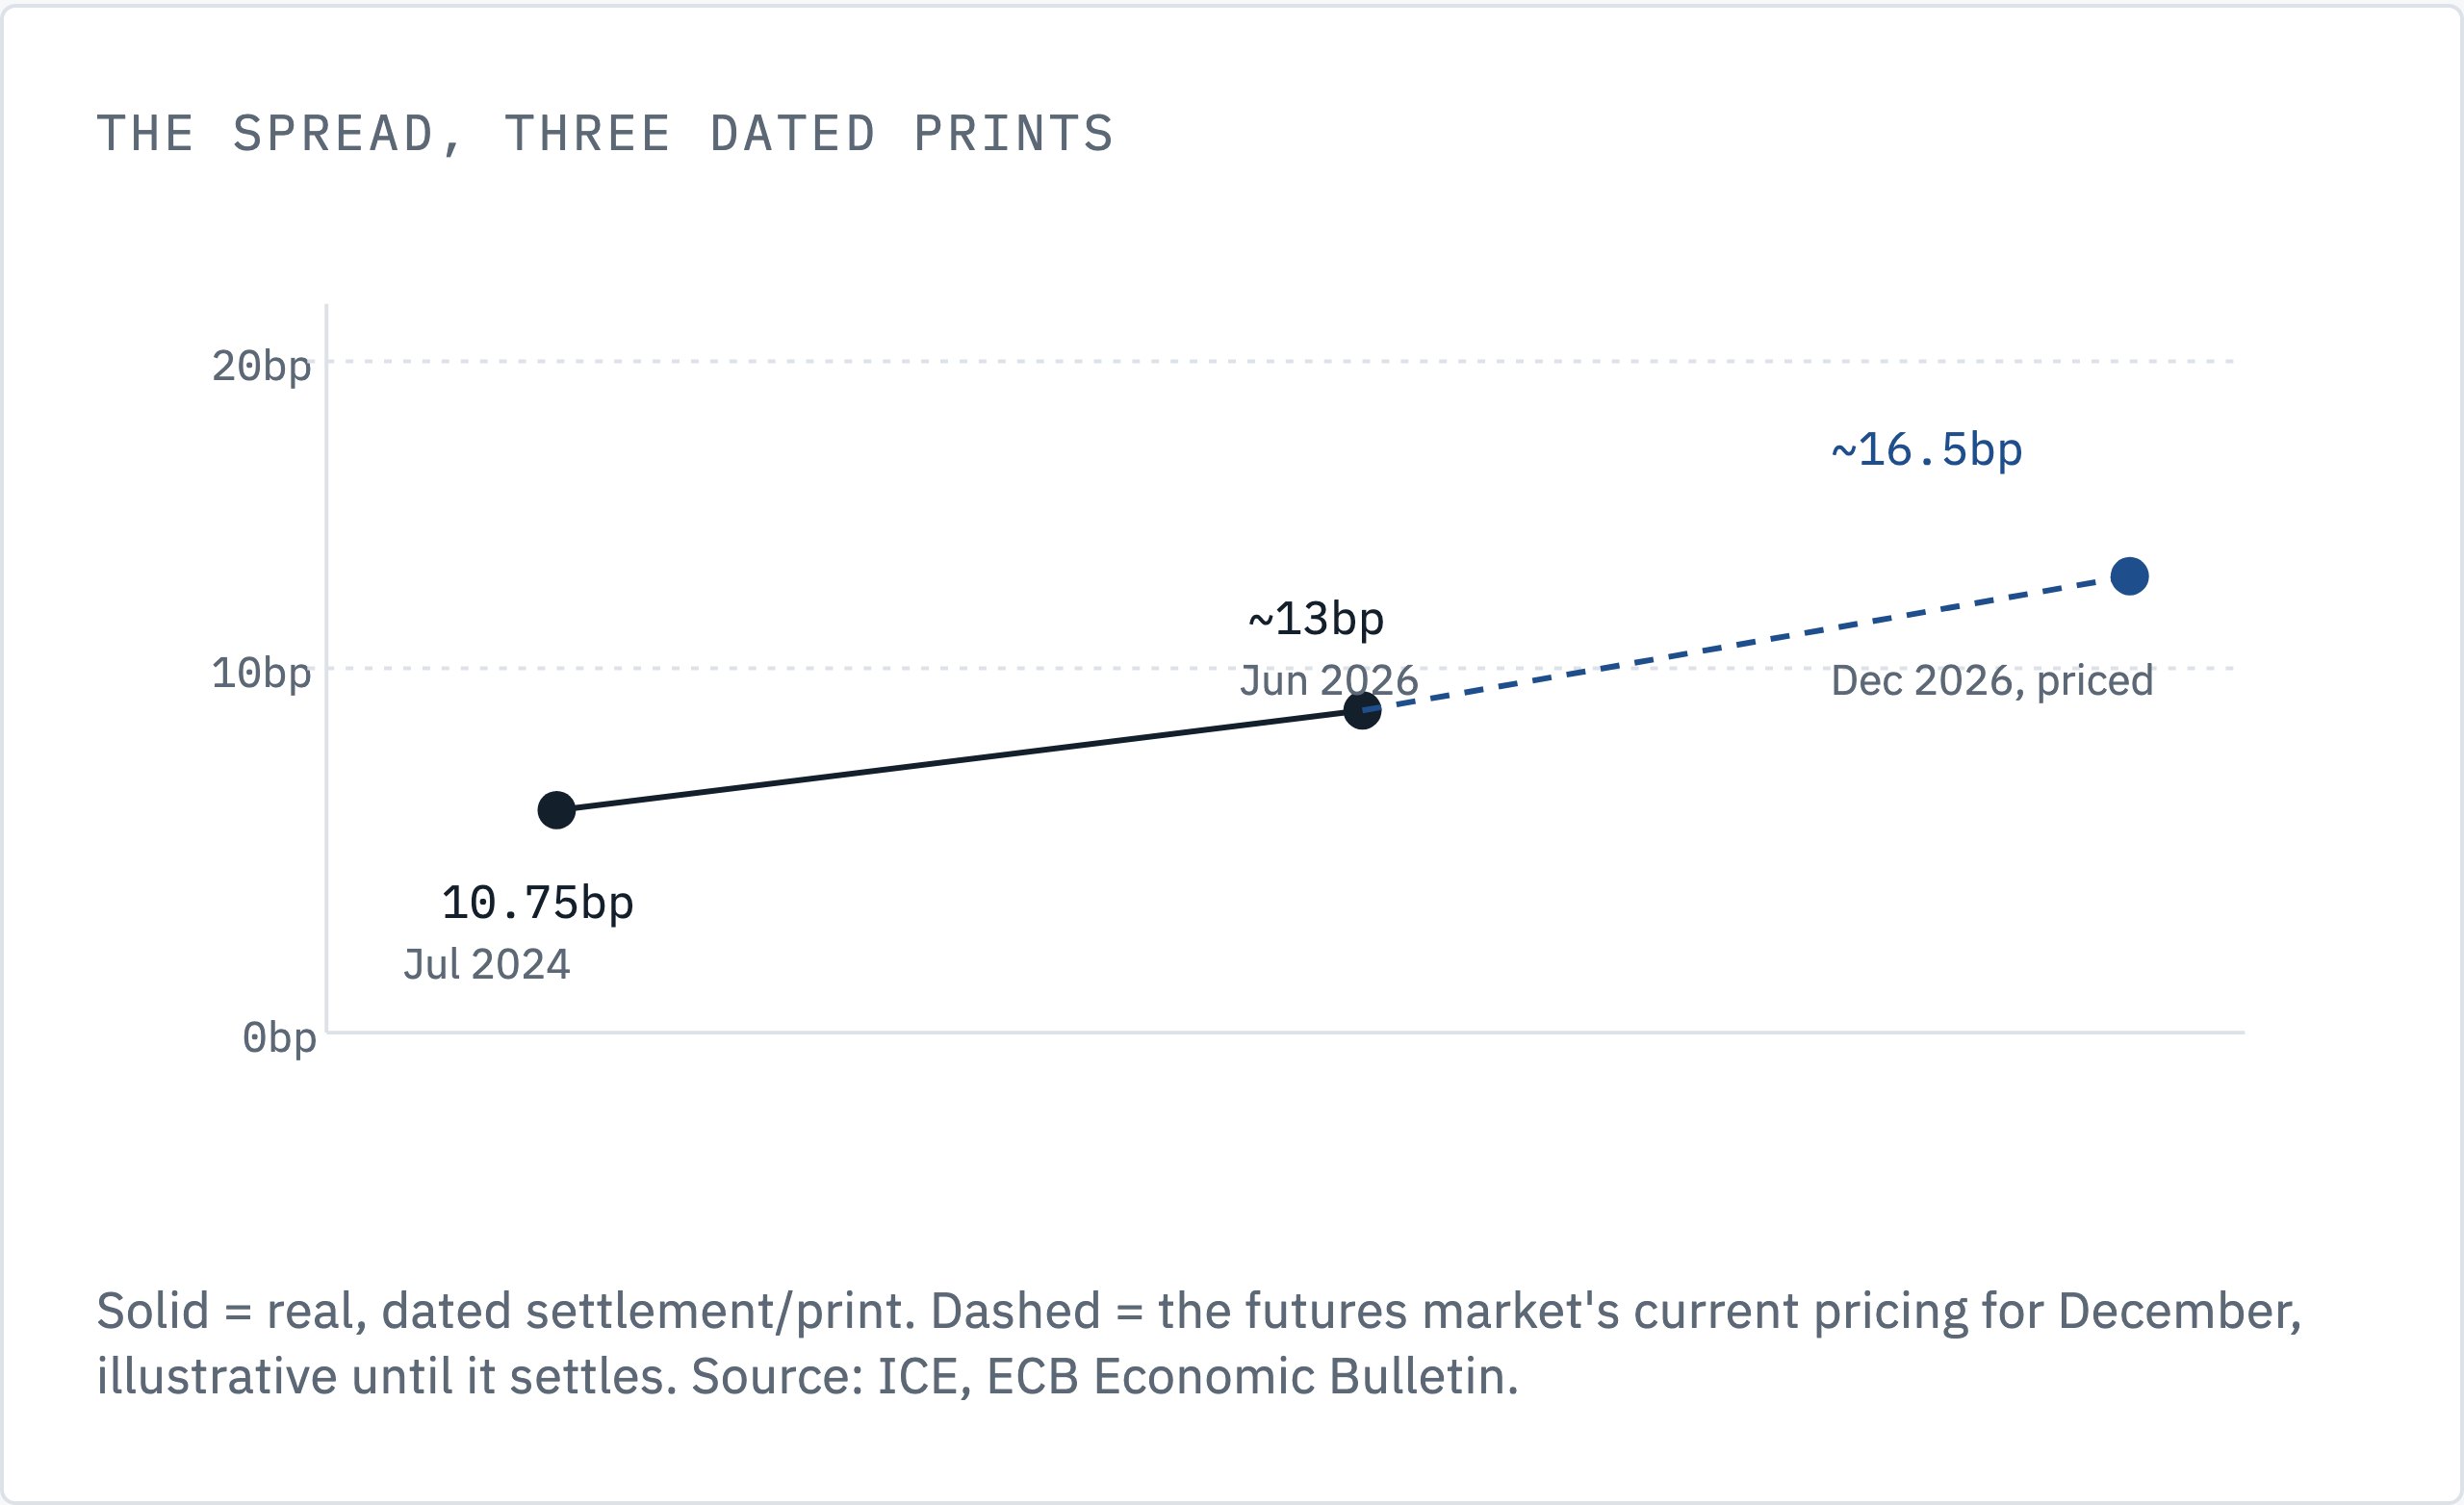
The spread itself has kept climbing regardless of what repo did at either turn: 10.75bp in July 2024, roughly 13bp this June, roughly 16.5bp priced for December, a climb of almost six points across contract months in a little over two years, though those three readings price against different Euribor expiries and are not a single clean time series. I don’t have a clean read on this spread’s own day to day volatility, so I can’t tell you whether 3.5bp sits comfortably outside normal noise or well within it. That is a real gap in what I can show you. What I can say is the direction has moved one way across every print I can source. Whether it resolves into a December spike or erodes the way repo’s own premium did in both 2024 and 2025 is the actual, unresolved bet.
The cushion argument alone has already failed once on its own terms. 2025 had a smaller reserve buffer than 2024 and still produced no repo spike, so “the cushion is shrinking” cannot be the claim doing the real work here. It already failed to predict the more recent, more comparable year. The distinction between secured and unsecured funding is what the thesis actually rests on, not the cushion trend, and I am not going to pretend otherwise. Below the paid line: the full ECB rate and liquidity table, the exact ICE contract construction sized against its 106,910 lot open interest record, the reflexivity problem worked through against the 40% above-DFR repo share, and the 31 December to 2 January settlement window that proves this trade right or wrong.
