


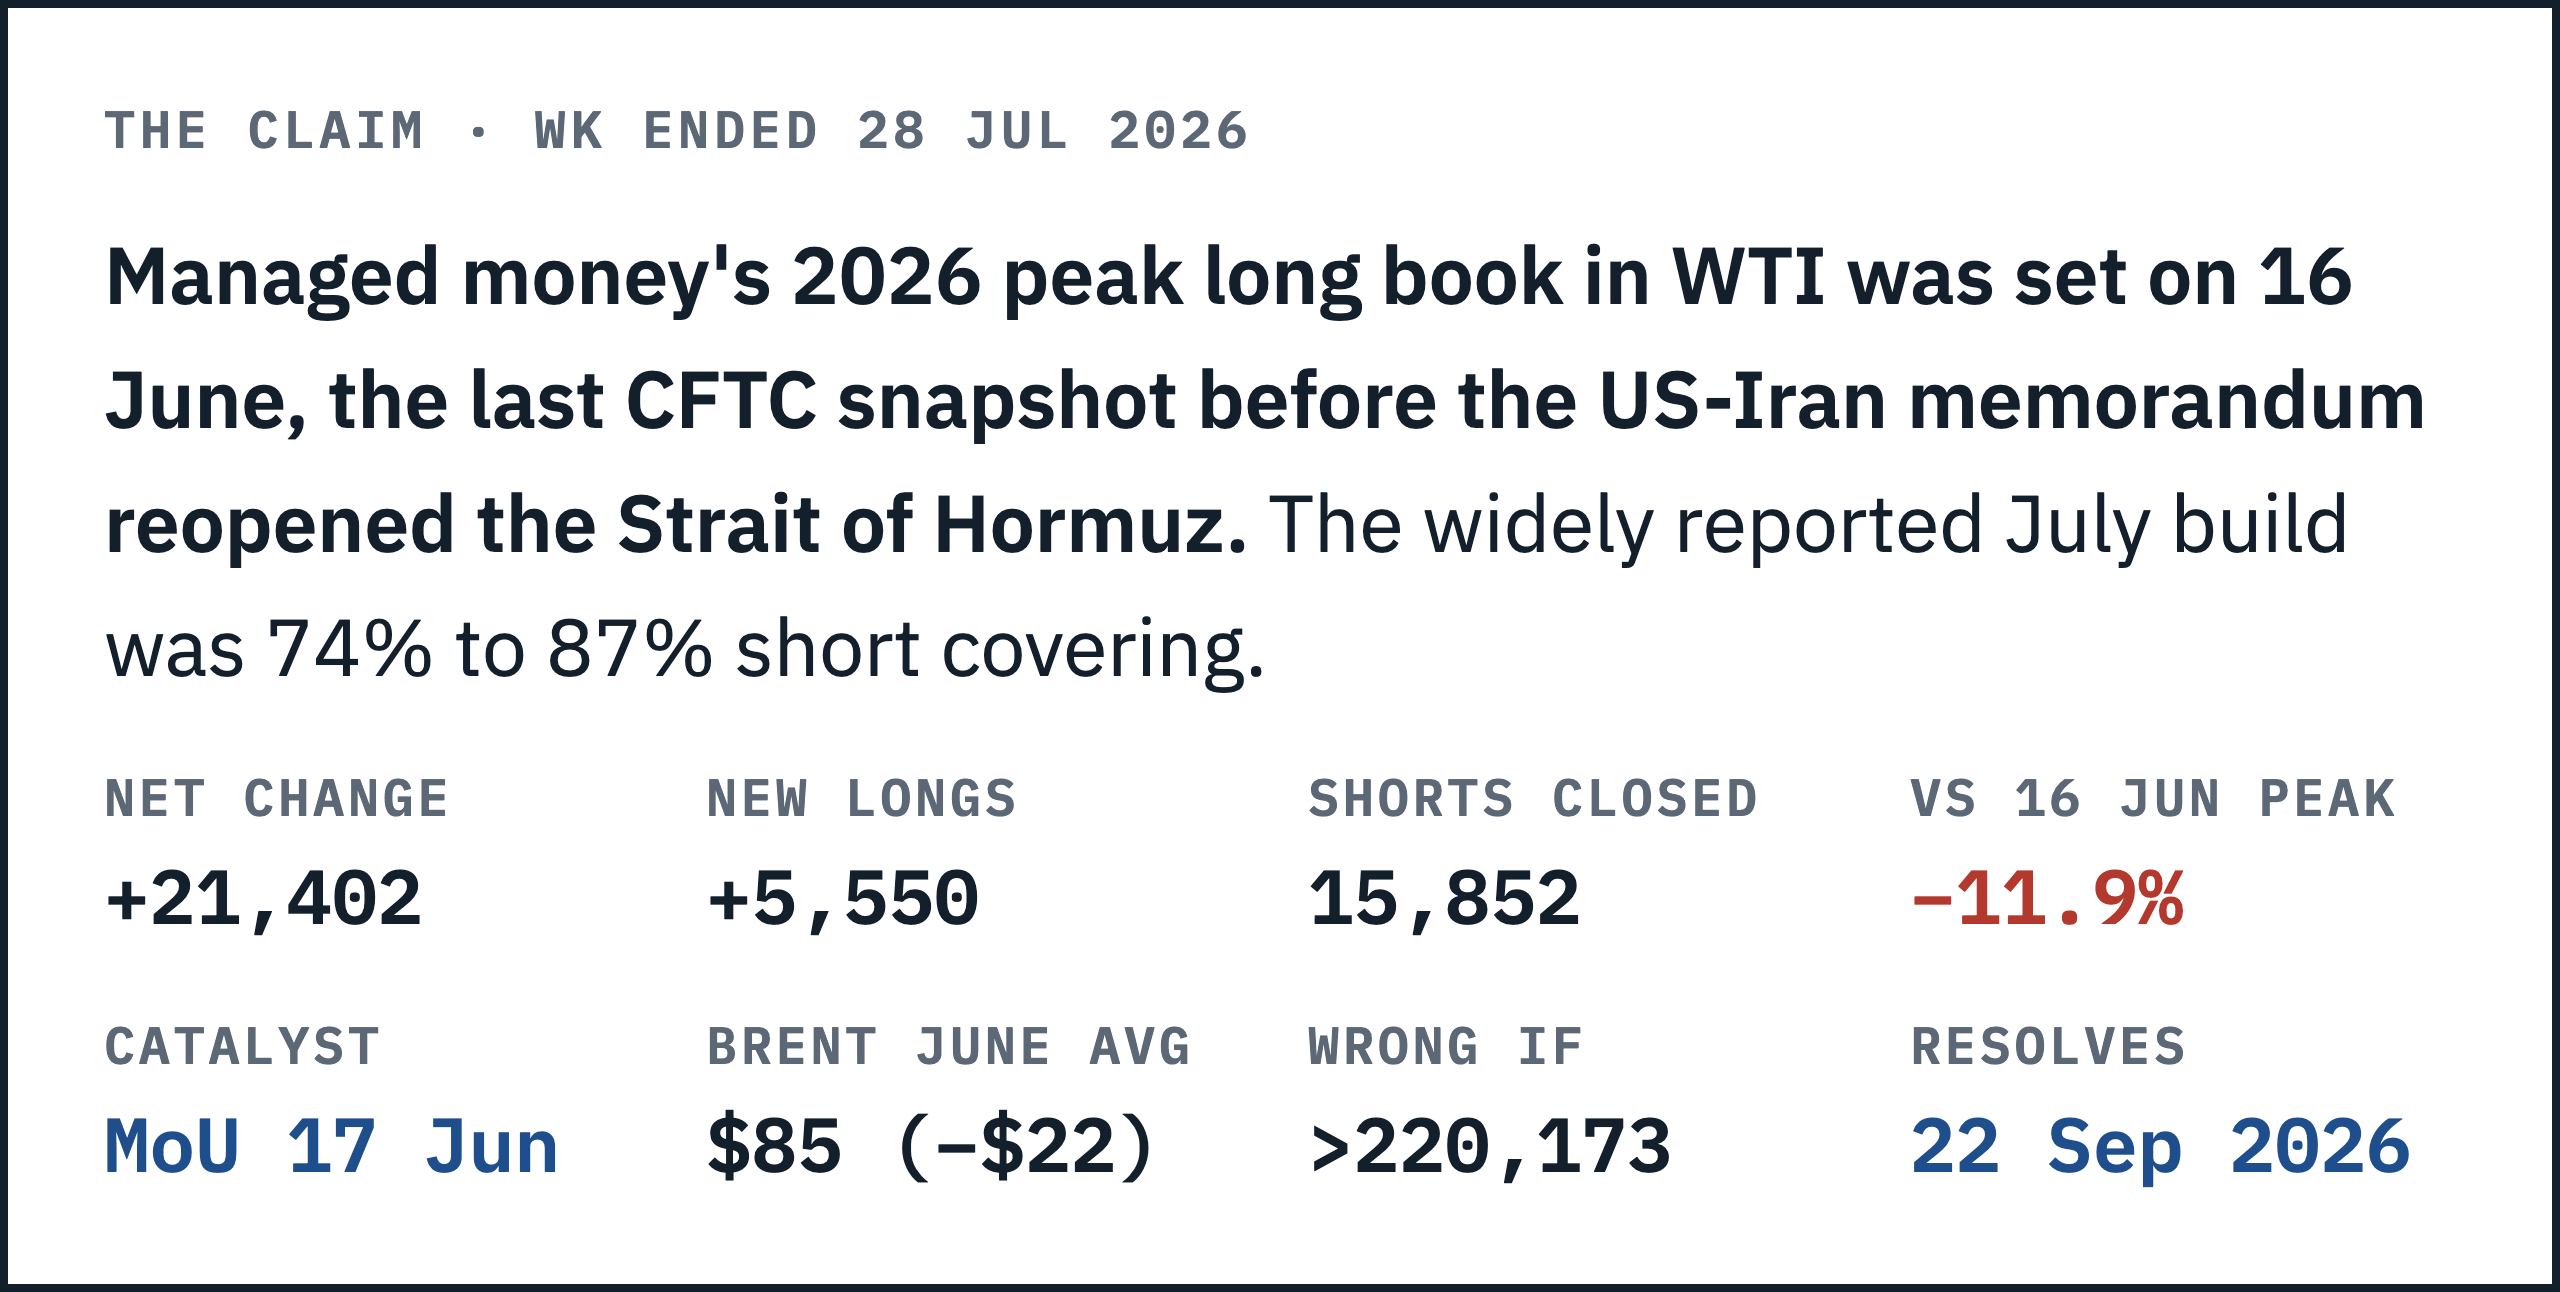
Managed money’s 2026 peak long book in WTI was set on June 16, the last CFTC snapshot before the United States and Iran signed a memorandum of understanding that reopened the Strait of Hormuz. Those funds were maximally long into a peace deal. The widely-reported July build that followed was 74% to 87% short covering, and gross longs are still 11.9% below that June peak.

The consensus, stated the way its believers would state it
Here is the strongest version of the view I’m departing from, and I think it’s reasonable.
Oil is repricing a supply shock and the fast money is finally engaging. The Strait of Hormuz was effectively closed from February 28, and roughly 20% of global oil supply used to move through it. Saudi Arabia rerouted around 5 million barrels a day through Yanbu, more than double prewar levels, with about four fifths of that going out through Bab el-Mandeb, which the Houthis have now declared closed to Saudi vessels (Bousso, via BOE Report, relaying Kpler tanker estimates). Ukrainian drone strikes have curtailed Russian refinery runs badly enough that Moscow moved to ban diesel exports, per the same column.
Inventories support it. US commercial crude stocks excluding the SPR fell from 441.7 million barrels on May 22 to 404.5 million on July 24 (EIA), a draw of 37.2 million in nine weeks. Cushing went from 23,024 thousand barrels to 18,599, down 19.2% (EIA).
I’ll strengthen that case before arguing with it, because the weekly path is less flattering to me than the headline draw. Most of the drawdown happened in May and June. Between June 26 and July 24 stocks fell only 3.9 million barrels, with builds on July 3 and July 17, and Cushing bottomed on June 19 and rebuilt to 20.0 million by July 10. Physical tightness is real. It was also decelerating through the month the positioning story is about.
The date nobody put next to the positioning data
Managed money’s gross long book in NYMEX WTI peaked for 2026 at 220,173 lots on June 16, with WTI at $79.80. It took me three passes through the file to see the date.
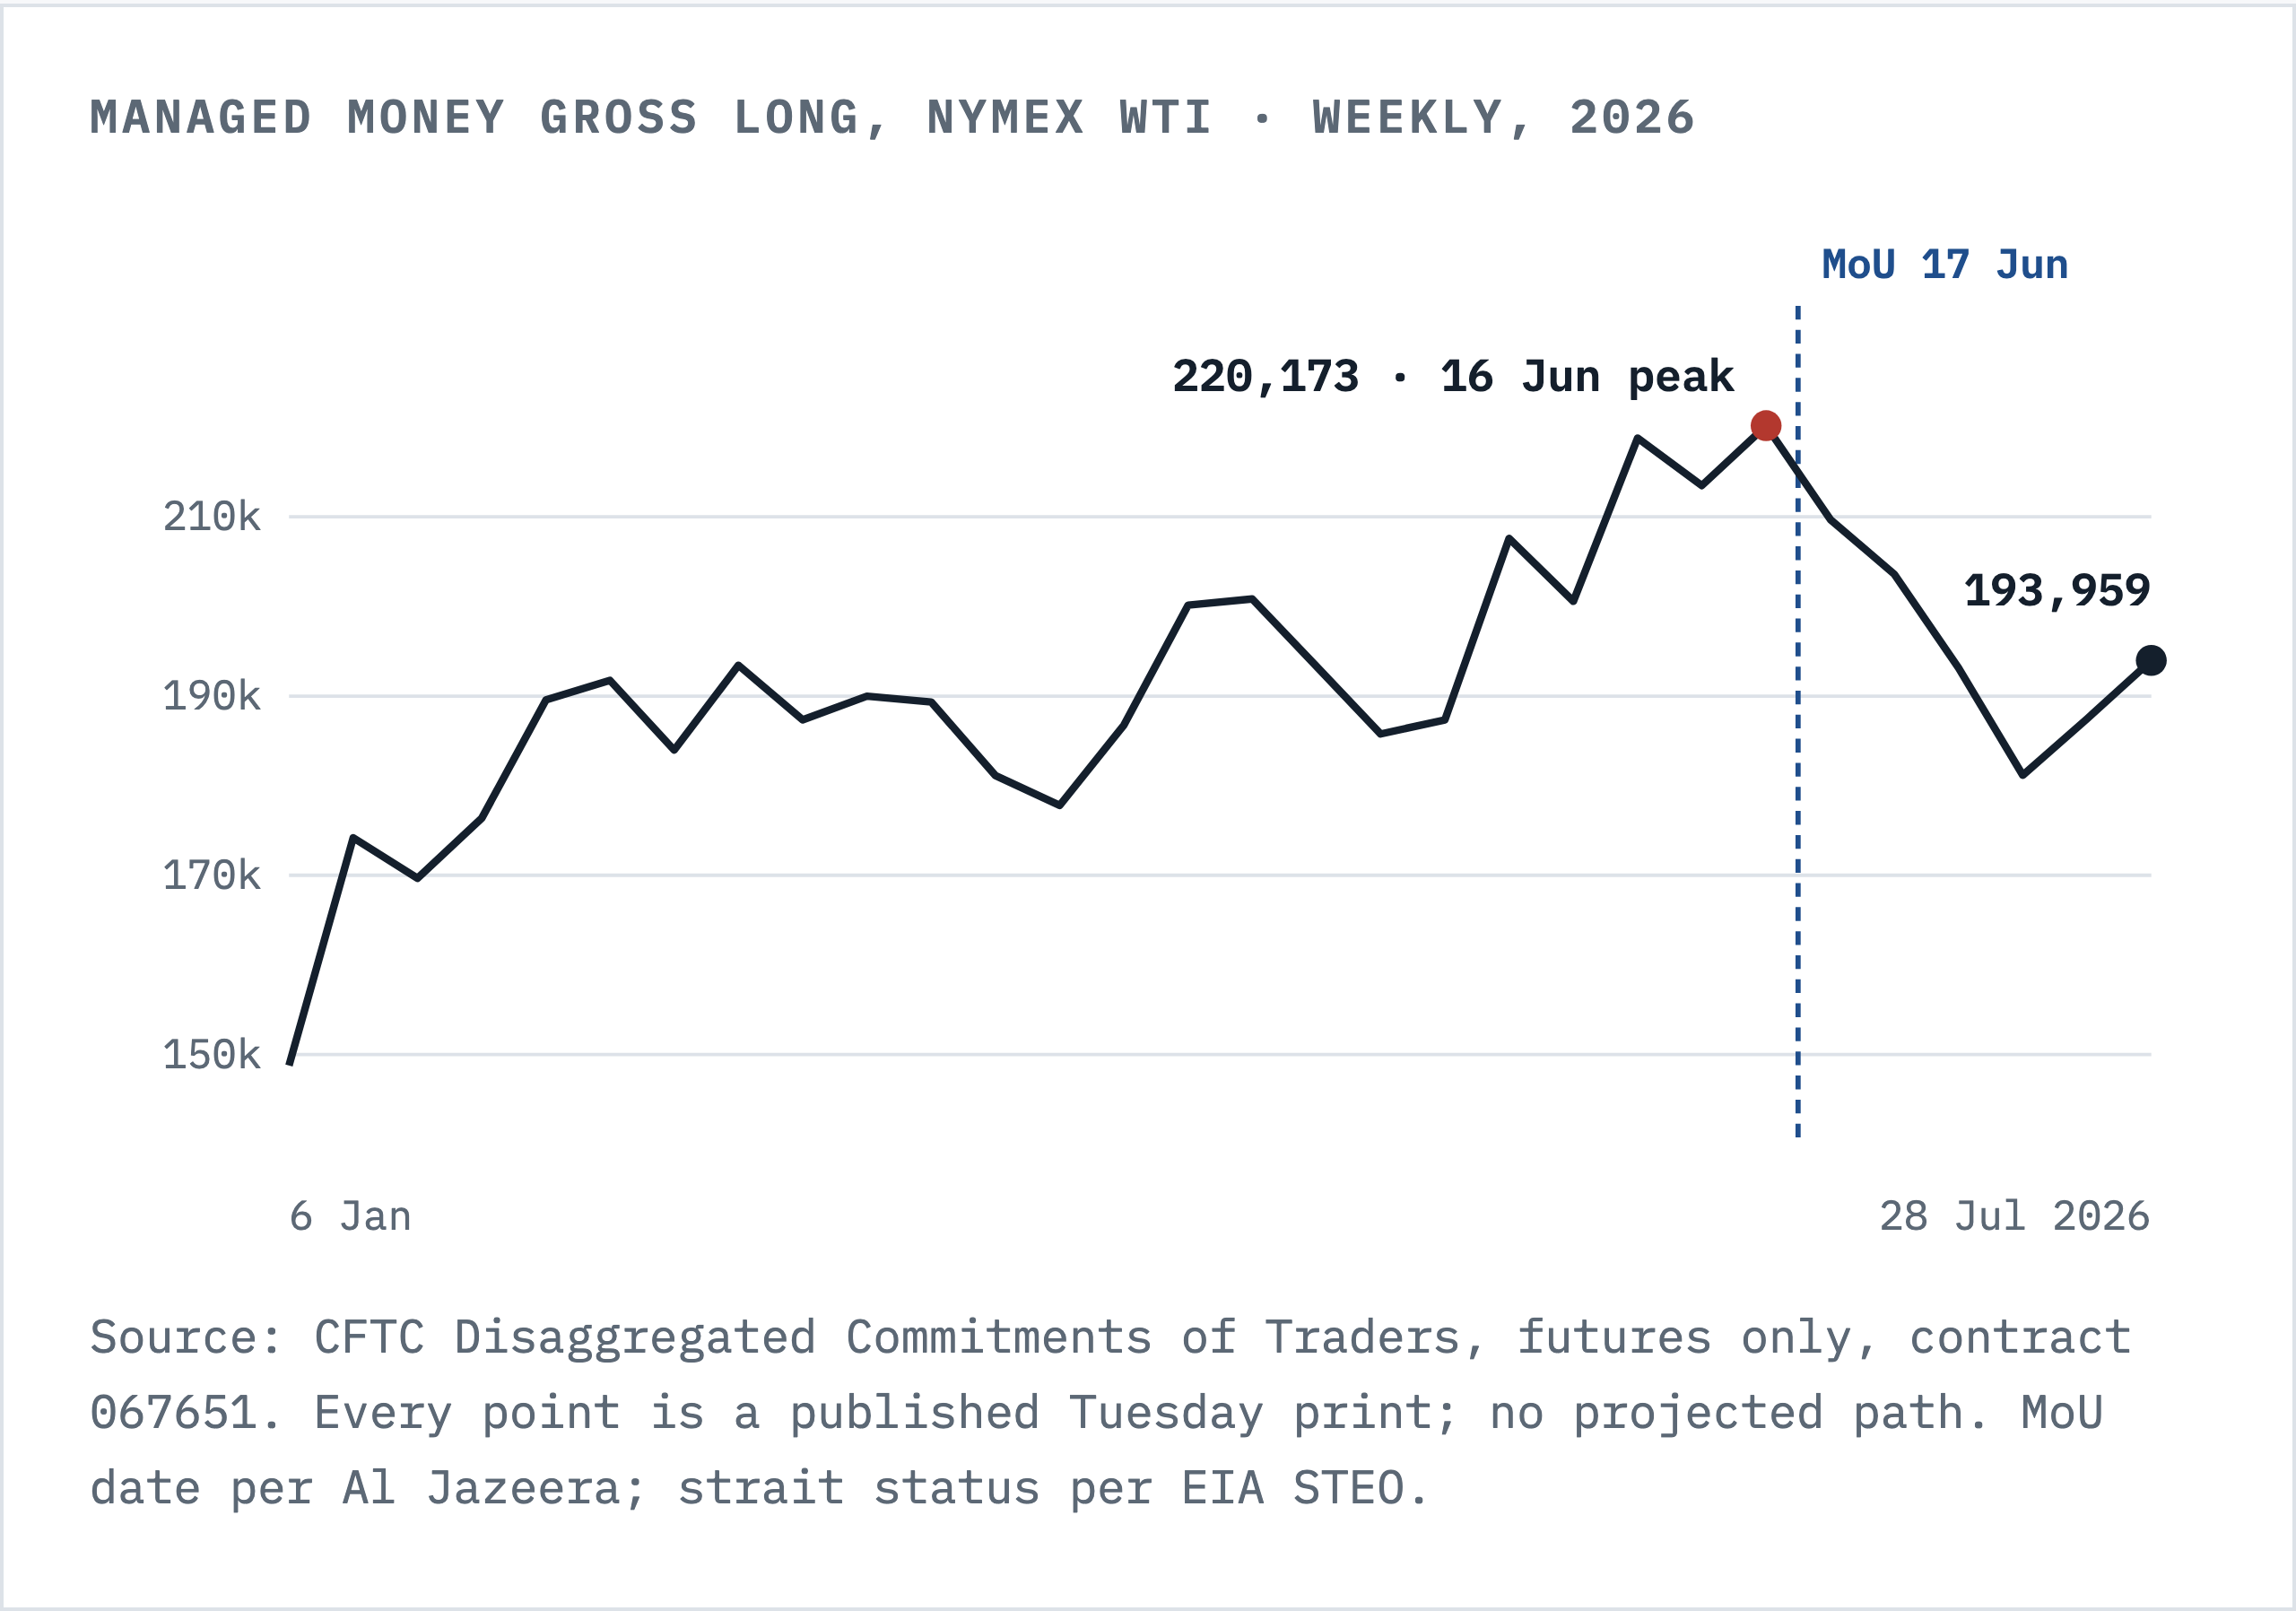
Be precise about what peaked, because a reader who checks will find the qualifier. That is the GROSS LONG book. Gross shorts were 123,945 that week, so net length was 96,228, fifth among 2026’s thirty weeks. June 16 is not the net peak and I don’t claim it is. Gross is the right frame here because the question is who owns length and whether they rebuilt it, and netting erases the distinction this piece turns on.
One day later, the United States and Iran signed a memorandum of understanding to end the conflict and open the Strait of Hormuz. The EIA records the strait as having “been effectively closed since February 28 when the conflict began” and reopening after the June 18 agreement. Brent averaged $85 that month, twenty-two dollars below May. On July 1 it broke $70.
June 16 is the last COT snapshot before that deal, and it sits one day before the event that destroyed the thesis underneath it.
Size it. Those 220,173 lots are 220.2 million barrels, and WTI fell from $79.80 on June 16 to $69.74 on July 1. Roughly $2.2 billion of mark-to-market on the gross long book in eleven days, about $968 million on the net book. Either way it landed on the people who had the view.
The reopening did not hold. Only 513 ships transited between June 18 and July 5, about 28 a day. Vessels were struck again on July 6 and 7, the truce broke, and crude ran from $69.74 on July 1 to $93.08 on July 23, up 33.5% (FRED). Brent reached $105.32, 53.7% above its July low of $68.53 on the 2nd (FRED).
That is the tape into which hedge funds are reported to have turned bullish. My read is that the reporting describes the wrong thing, and the June date is why. What I think happened is simpler than a change of view: the funds that had the view already owned it, in size, and lost on it.
One concession before I go further, because the section above deserves it. Nothing here refutes the physical case. Inventories drew, the strait is contested, and if barrels are short then crude can rise whatever the positioning file says. What I am falsifying is narrower: the claim that this particular print is evidence of professional conviction. It is evidence of the opposite, and those are different arguments.
What the July build was actually made of
Week ended July 28, on the series the wire used, managed money’s net long rose 21,402 lots to 108,307. I pulled the CFTC’s own archives and rebuilt it: long 195,035, short 86,728, prior net 86,905. It reconciles to the contract.
Composition is where it stops being a story about conviction.
One tradecraft note first, because it decides whether any of this reproduces. NYMEX WTI carries CFTC market code 067651, and in current files it answers to the name WTI-PHYSICAL. Search those files for “crude oil, light sweet” and the only match you get is 067411, which is the ICE Futures Europe contract. Wrong exchange. Wrong book. Wrong answer. The old NYMEX name was retired, so anyone matching on the label instead of the code is quietly reading the wrong market.
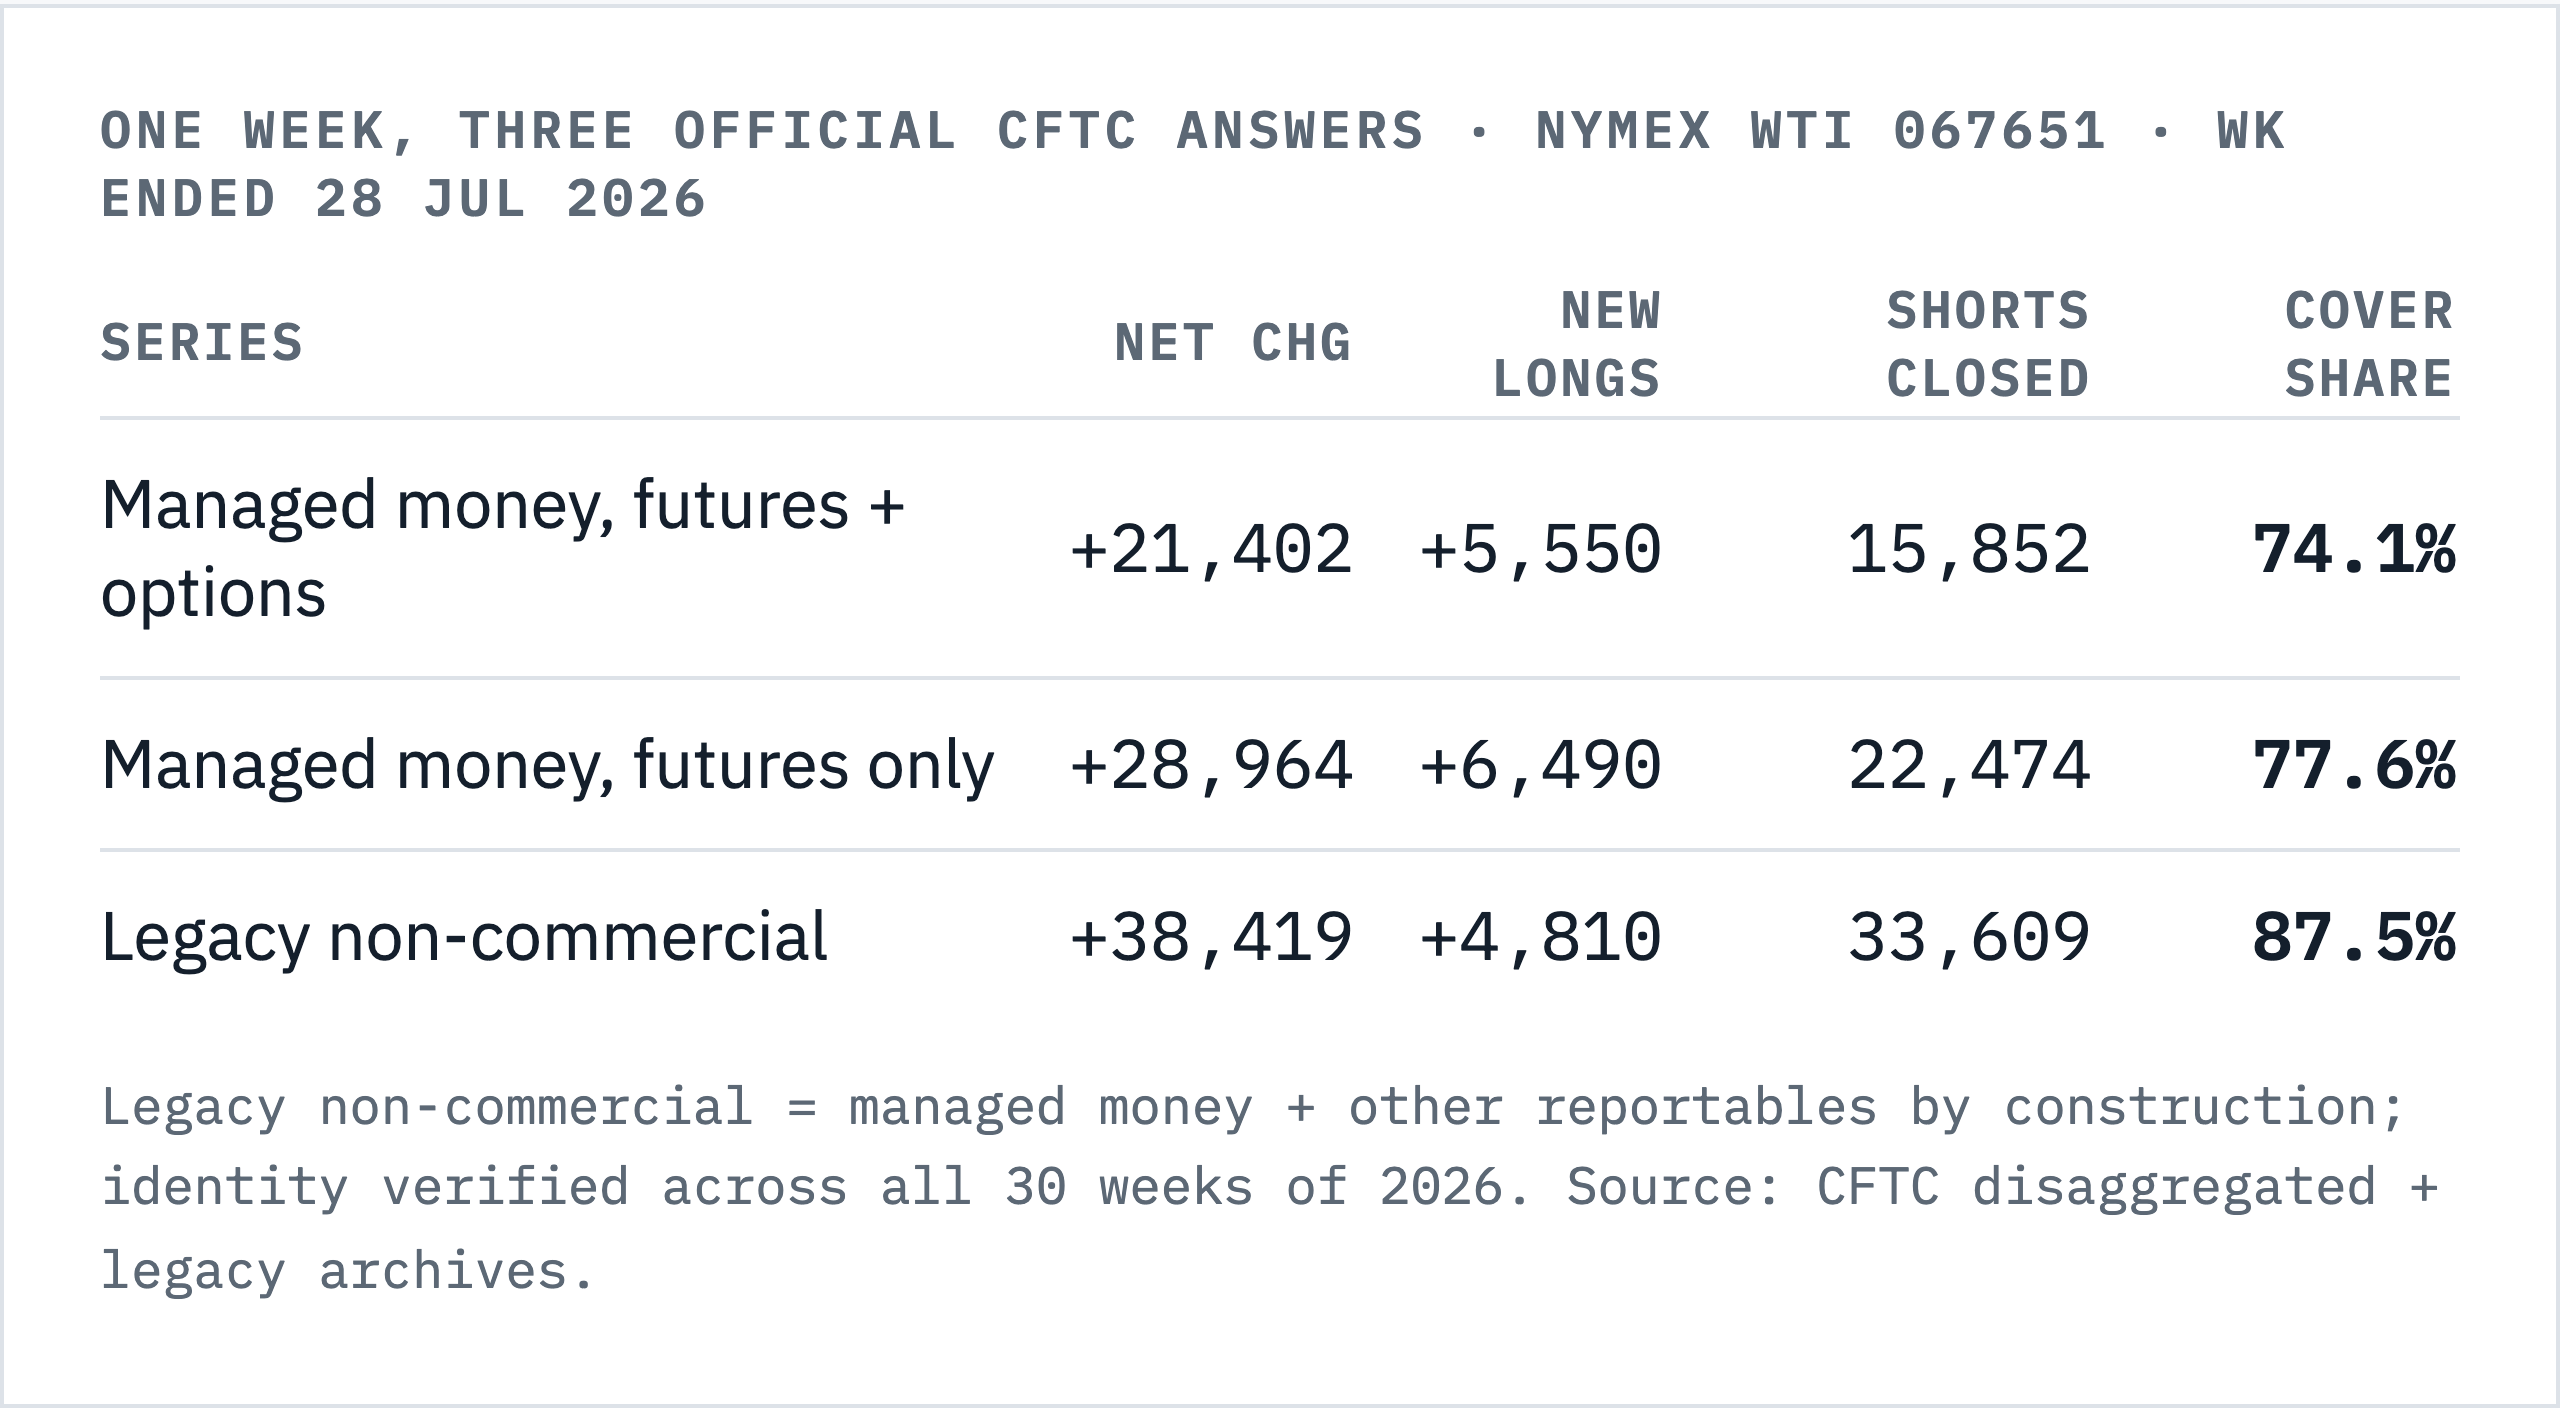
Three official numbers for one week, and the gap between them is no disagreement: legacy non-commercial is managed money plus other reportables by construction, and the other two are one population with and without options. I checked that identity across all thirty weeks of 2026 and it holds exactly. What the rows are useful for is what they agree on. Across every cut, new longs came to between 4,810 and 6,490 lots while short covering supplied 74% to 87% of the build.
Futures-only gross longs at 193,959 remain 11.9% below the June 16 peak, and on the legacy series 314,992 is 20.2% below the peak of 394,651 set on March 10. (The 195,035 in the table above is the combined series, which carries its own peak of 226,150 from April 14; mixing the two is the exact error this piece is about.) Six weeks on, the long book has not come back. The buying that made the headline came from traders closing losing shorts.
A caution, because I nearly overclaimed it. That agreement is not three independent measurements converging. They are three cuts of the same trader reports, so any classification error propagates through all three identically. Nor is it a general property: on March 10 the managed-money futures series shows an 88.8% short-cover build while legacy shows 29.3%, a long-driven one, same week, same contract. Composition agreed this week. It does not always.
Who took the other side, and the one number that argues against me
Somebody sold managed money those 28,964 lots. The disaggregated file names them, and the five categories net to exactly zero, which is a useful check on my own arithmetic.
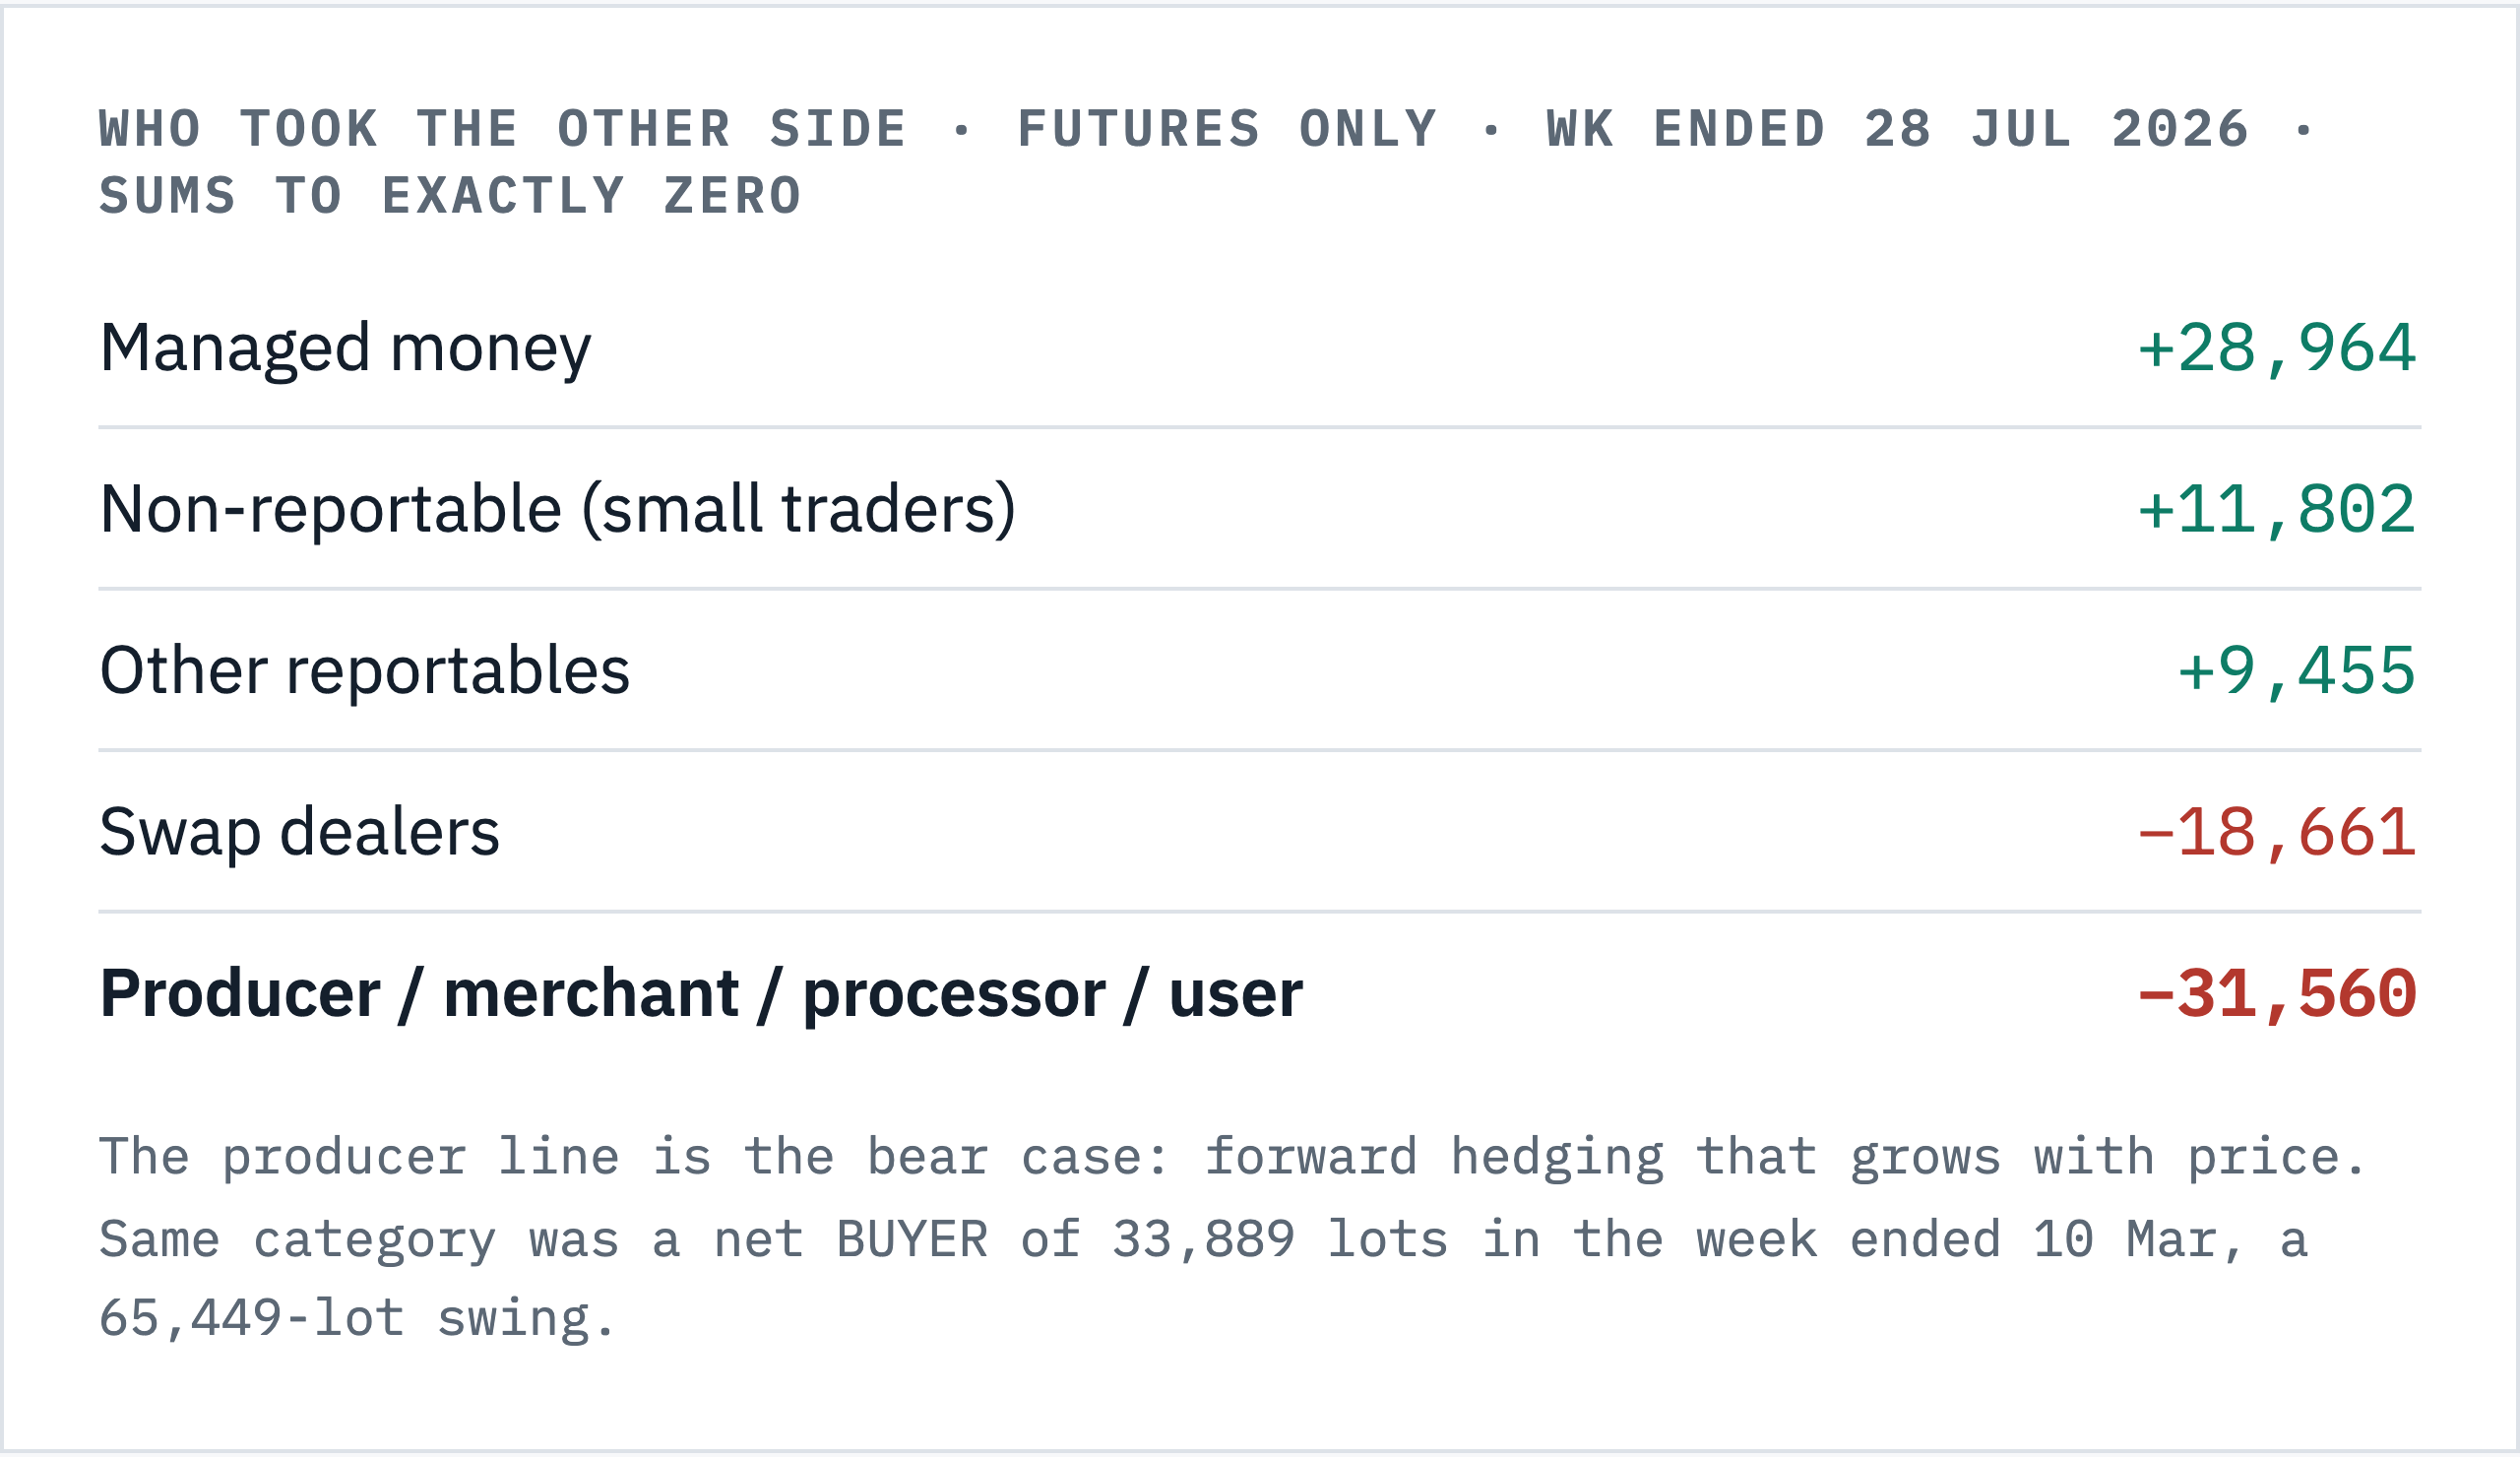
That bottom row is the strongest argument against everything I’ve written. Read it twice. Physical industry sold 31,560 lots net into the spike. A producer or merchant, in the CFTC’s own words, is “an entity that predominantly engages in the production, processing, packing or handling of a physical commodity and uses the futures markets to manage or hedge risks associated with those activities.” At $93 crude those firms did what they exist to do and hedged forward barrels.
Compare it to March. In the week ended March 10, the same category were net buyers of 33,889 lots, unwinding hedges because they thought the curve had further to run. Now they sell. That is a swing of roughly 65,000 lots between two weeks whose positioning structure otherwise rhymes, and producer hedging is forward selling that grows as prices rise. It is precisely the mechanism that caps a squeeze.
People closest to the barrels are using $90 crude to lock in revenue. I can’t wave that off, and I’d weight it above my own positioning read if the two ever pointed different ways.
