


Boaz Weinstein’s Saba Capital $2 billion flagship credit fund is down 6.5% in 2025. His $1 billion tail hedge fund has bled 12.7% this year. Yet the firm manages $6 billion in regulatory assets as of August 2025, earned Institutional Investor’s “Activist Hedge Fund Manager of the Year” in both 2023 and 2024, and runs five structurally different profit engines that most observers treat as separate businesses.

This isn’t a contradiction. It’s deliberate architecture. Each engine generates alpha under different market conditions: quantitative credit arbitrage (London Whale), tail-hedged carry trades (COVID), discount-to-NAV capture (SPACs), closed-end fund activism, and investment-grade CDS underwriting. When credit markets are calm — as in 2025 — the flagship struggles. When volatility spikes, it prints money.
This is the forensic breakdown of how each engine generates returns, starting with the foundational strategy that powers all five.
The Structural Edge: Credit vs. Equity Derivatives Mispricing (1998-Present)
Weinstein’s foundational alpha comes from a pricing anomaly that persists across cycles: credit and equity derivatives on the same company price risk differently.
At Deutsche Bank from 1998–2009, where he became Managing Director at 27 while running a $30 billion internal hedge fund, Weinstein pioneered capital structure arbitrage. The strategy: buy out-of-the-money puts on a stock, hedge with the company’s bonds. When spreads converge, extract the differential.
Documented trades:
Household International (2002): Bought bonds trading at 800bps over Treasuries, CDS at 900bps. Partially hedged by shorting equity. HSBC’s acquisition announcement tightened credit spreads violently — bond gains exceeded equity hedge losses.
General Motors (2005): Sold CDS protection on GM debt while shorting the stock as GM faced junk rating but maintained elevated equity prices.
Deutsche Bank P&L:
2006: +$900 million
2007: +$600 million
2008: -$1.8 billion
January 2009: Recovered ~$600 million
Weinstein left Deutsche Bank in February 2009 with 15 team members, forming Saba Capital in April 2009. The firm launched its flagship Capital Master Fund in August 2009 with $140–160 million in initial capital.
The capital structure arbitrage foundation would power all five engines. But the first major test — and public validation — came from a quantitative mispricing that JPMorgan failed to detect.
Engine 1: The London Whale — Quantitative Index Arbitrage ($200–300M, 2011–2012)
This wasn’t macro intuition. It was model-detected mispricing.
Detection (November 2011): Saba’s systems flagged the Markit CDX North America Investment Grade Series 9 10-Year Index trading significantly cheaper than fair value. Someone was selling enormous CDS protection, pushing the index below model prices.
That seller was Bruno Iksil at JPMorgan’s Chief Investment Office in London. JPMorgan’s CIO portfolio exploded from $51 billion notional at year-end 2011 to $157 billion by March 31, 2012.
Execution: Weinstein began buying CDS protection on CDX IG9 without initially knowing JPMorgan was the counterparty. He was exploiting measurable mispricing between index spread and constituent single-name CDS.
In February 2012, Weinstein publicly recommended the trade at an investment conference, urging hedge funds to buy protection because the large seller persisted.
Initially, the trade went against Saba — one of Weinstein’s funds was down 20% heading into May. Then Europe’s debt crisis intensified, positions reversed, and Weinstein made back all losses “in a matter of weeks”.
CEO Jamie Dimon dismissed concerns as a “tempest in a teapot” in April 2012. JPMorgan disclosed $2 billion in losses in May, ultimately totaling $6.2 billion, plus $920 million in regulatory fines.
Saba’s profit: $200–300 million. AUM peaked at $5.6 billion after the trade.
The London Whale validated quantitative credit arbitrage at scale. Eight years later, the same model-driven scanning system would detect an even larger mispricing — one driven not by a single trader, but by structural distortions across the entire credit curve.
Engine 2: The Pandemic Trade — Zero-Cost Tail Protection (+99% in March 2020)
Late 2019: Saba’s quantitative systems — which continuously scan approximately 18,000 bonds and 800 different CDS contracts — identified unprecedented mispricing. High-yield credits like cruise lines and airlines traded at similar CDS spreads to investment-grade names like AT&T and IBM.
The Setup: As Weinstein told Risk.net, banks buying CDS protection on companies they lent to (like IBM for its $34 billion Red Hat acquisition) had driven up investment-grade protection costs. Simultaneously, traders arbitraging the HY CDX index fed markets cheap CDS on high-yield names by selling protection on single names.
Saba built long CDS positions on Royal Caribbean, United Airlines, Sabre Corp., and Vue International, while selling protection on AT&T and IBM. Positions were established at “basically zero cost” — structured as carry-neutral relative-value trades.
Critical innovation: Traditional tail hedges (S&P 500 puts, VIX calls) bleed premium daily. Saba’s credit-based tail hedge was carry-neutral with “no negative carry or bleed”.
Execution (January-March 2020): As pandemic news intensified, Saba added $1 billion to its curve-flattening trade and approximately $500 million to its short CDS portfolio.
On February 21, 2020, as Italy reported COVID clusters, five-year Sabre CDS closed at 30 basis points. By March, Sabre traded at 350bps while McDonald’s remained at 25bps.
Saba held “tens of billions of notional CDS” during the crash.
Performance:
Tail Fund: +99% in March 2020
Flagship Fund: +33% in March 2020
The crisis attracted $1.7 billion in inflows. Risk.net named Saba “Hedge Fund of the Year” in 2021.
Exit mechanics: Mass selling created negative basis between bonds and CDS. Saba bought crashed cash bonds against short CDS positions to capture convergence. The opportunity was so large Saba launched a dedicated “Basis Opportunities Fund” in May 2020.
The pandemic trade proved tail protection didn’t require premium bleeding. While credit mispricing drove Engines 1 and 2, a parallel opportunity emerged in equity-linked structures trading below intrinsic value — requiring zero credit analysis.
Engine 3: SPAC Arbitrage — “Bonds with an Equity Call Option” ($6.7B Peak, 2021–2022)
SPACs provided asymmetric downside protection with upside optionality.
Mechanics (as explained to Forbes):
Buy SPAC shares below $10 trust value (typically $9.70-$9.80)
Collect spread — SPAC trusts invest in U.S. Treasuries
Downside capped — shareholders can redeem at ~$10 + accrued interest
Upside uncapped — popular mergers spike shares above $10
Weinstein called this a “call option on euphoria”. Critically, he used SPAC arbitrage yields to finance the cost of credit protection — creating a self-funding tail hedge.
Scale: By mid-2022, Saba held approximately $6.7 billion in SPACs, among the largest SPAC investors globally.
Notable exit: Saba sold its stake in the SPAC that took Trump’s social media platform public immediately upon target announcement.
By end-2021, Saba was the fourth-biggest SPAC hedge fund investor with $4.26 billion invested.
SPACs exploited structural mispricing in equity-linked vehicles. But another discount-to-value opportunity existed at even larger scale — one that required activist pressure, not passive arbitrage.
Engine 4: Closed-End Fund Activism — Buying “Dollars for 80 Cents” ($3.66B, Ongoing)
Saba’s highest-returning strategy today targets structural discounts in closed-end funds.
The trade: Buy CEFs trading at 10–20% discounts to NAV, pressure boards through activism to close the gap via tender offers, conversions to open-end funds, or liquidations.
As of Q3 2025, Saba held 329 CEF positions worth $3.66 billion.
BlackRock Campaign (2023–2025): Saba waged an 18-month battle against BlackRock. In December 2023, Saba won a court ruling invalidating shareholder voting restrictions.
Settlement announced January 21, 2025:
Tender offers: BIGZ (50% of shares), BMEZ (40% of shares) at 99.5% of NAV
BlackRock to repurchase approximately $1.6 billion in shares
3-year standstill agreements through 2027 proxy season
UK Investment Trust Campaign (2024–2026):
December 2024: Saba targeted seven UK investment trusts (Baillie Gifford US Growth, CQS Natural Resources, Edinburgh Worldwide, European Smaller Companies, Henderson Opportunities, Herald Investment Trust, Keystone Positive Change).
February 2025: Six of seven trusts rejected Saba’s proposals. Excluding Saba’s votes, 98.4% of Edinburgh Worldwide shareholders voted against.
May 2025: CQS Natural Resources agreed to 100% tender offer at NAV, plus ~8% annual dividend and 20bps fee reduction. 46% of shareholders tendered, including Saba’s full holding.
January 2026: Edinburgh Worldwide shareholders rejected Saba’s second attempt — 92.7% voted against (excluding Saba’s shares).
SpaceX Controversy: Saba accused Edinburgh Worldwide’s manager Baillie Gifford of selling down SpaceX stake in October 2025 at inopportune moment, estimating £37 million in shareholder losses — two months before revaluation increased SpaceX’s worth.
Performance:
Closed-End Opportunities Fund 1 ($240M): +17.7% (2023), +20.2% (2024)
CEFS ETF (NAV return): +23.48% (2024), +15.53% (2025)
CEF activism delivered double-digit returns while the flagship struggled. Meanwhile, Saba quietly launched its fifth engine — returning to Weinstein’s original expertise in credit derivatives, but this time as a premium seller, not buyer.
Engine 5: Selling CDS on Big Tech AI Debt (November 2025-Present)
Saba’s newest revenue stream: acting as insurance underwriter for AI-driven debt accumulation.
November 2025: Saba began selling CDS protection on Oracle, Microsoft, Meta, and Amazon to banks worried about AI infrastructure debt. This was the first time Saba had provided such hedging for some of these companies.
Context:
Meta plans up to $600 billion in AI infrastructure through 2028
Oracle sold $18 billion in investment-grade bonds in September 2025
CDS spreads on Oracle and Alphabet reached two-year highs
Weinstein is earning premium by selling protection on companies he judges creditworthy despite explosive debt growth.
Five engines running simultaneously — each designed for different market regimes. Which explains why the flagship struggles in 2025 while CEF activism thrives. The architecture isn’t broken. It’s working exactly as designed.
The Flagship’s Structural Problem — By Design
Annual Performance (~$2 billion flagship fund):
2020: +33% (COVID crash)
2022: +22% (bond/equity sell-off)
2023: -16.9% (credit spreads compressed)
2024: +3.4% (spreads remained tight)
2025 (to Nov 21): -6.5% (markets rebounded from tariff shock)
$1 billion tail fund:
2023: -16.7%
2024: -2.7%
2025: -12.7%
Market warnings:
April 2023: Warned “There’s going to be a huge problem in private credit,” predicting stress for insurers in private credit and commercial real estate.
April 2025: Warned of credit “avalanche,” predicting tariff-driven inflation would limit the Fed and bankruptcies would spike “much faster than in other crises.”
The flagship’s struggles reflect deliberate positioning for credit dislocations that haven’t materialized at scale since 2022. The same mechanics that produced +33% in 2020 and +22% in 2022 remain primed to trigger when spreads blow out.
This is why Weinstein runs five strategies instead of one. Each engine targets different market conditions. When volatility is suppressed and credit spreads are tight — as in 2025 — Engines 1 and 2 (credit arbitrage and tail hedging) underperform. But Engines 4 and 5 (CEF activism and tech CDS) print money. Here’s the current state of all five:
The Portfolio View: Five Engines Running Simultaneously
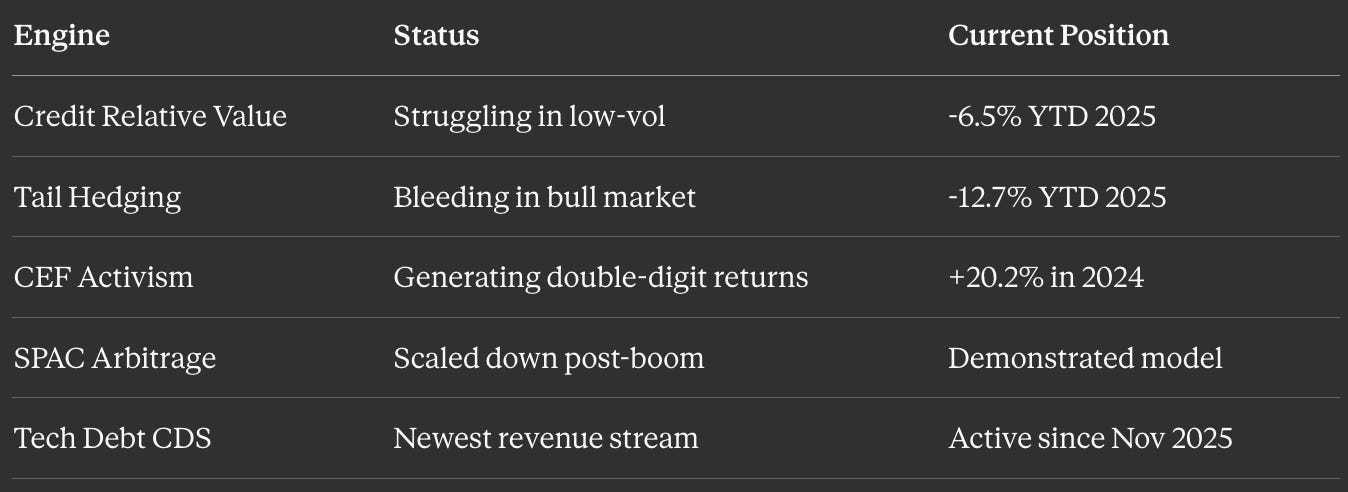
As of August 2025, Saba manages $6 billion in regulatory assets. The firm’s 13F shows 329 CEF positions worth $3.66 billion as of Q3 2025.
📊 Want Deeper Quantitative Analysis?
This research took very long time of data collection, verification, and analysis. If you found value in this deep-dive, I publish exclusive quantitative research, trading strategies, and institutional-grade analysis on Patreon.
By joining, you’ll be supporting my work and motivating me to publish more content like this.
→ Join the Patreon community here
The opening paradox resolves itself: a -6.5% flagship fund and “Activist Hedge Fund Manager of the Year” awards aren’t contradictory. They’re evidence of successful architectural design. When one engine struggles, another accelerates.
The chess master who learned the game at five, became a U.S. Chess Federation Life Master at 16, and was banned from casinos for card counting now runs five structurally independent arbitrage engines with $6 billion across markets most traders treat as separate asset classes.
The flagship bleeds by design in low-volatility regimes. The CEF strategy compounds at 20%+ regardless of credit conditions. The tail fund costs money until it doesn’t. The core bet: credit dislocations will arrive before tail hedge costs overwhelm activism profits.
As Weinstein told Investment Week: “I am a hedge fund manager trying to make money for my investors.”
About the Author
Navnoor Bawa is a quantitative finance researcher specializing in systematic trading strategies and hedge fund analysis. He publishes technical deep-dives on institutional strategies and quantitative trading systems.
📺 YouTube: The Mathematical Trader — Quantitative finance analysis and trading strategies
💼 LinkedIn: Navnoor Bawa — Connect for quant finance insights
📊 Patreon: Exclusive Research & Strategies — Support deep-dive research like this
If you found this analysis valuable, consider subscribing to the YouTube channel and connecting on LinkedIn.
Cover photograph: Kidfly182, CC BY 4.0, via Wikimedia Commons.