


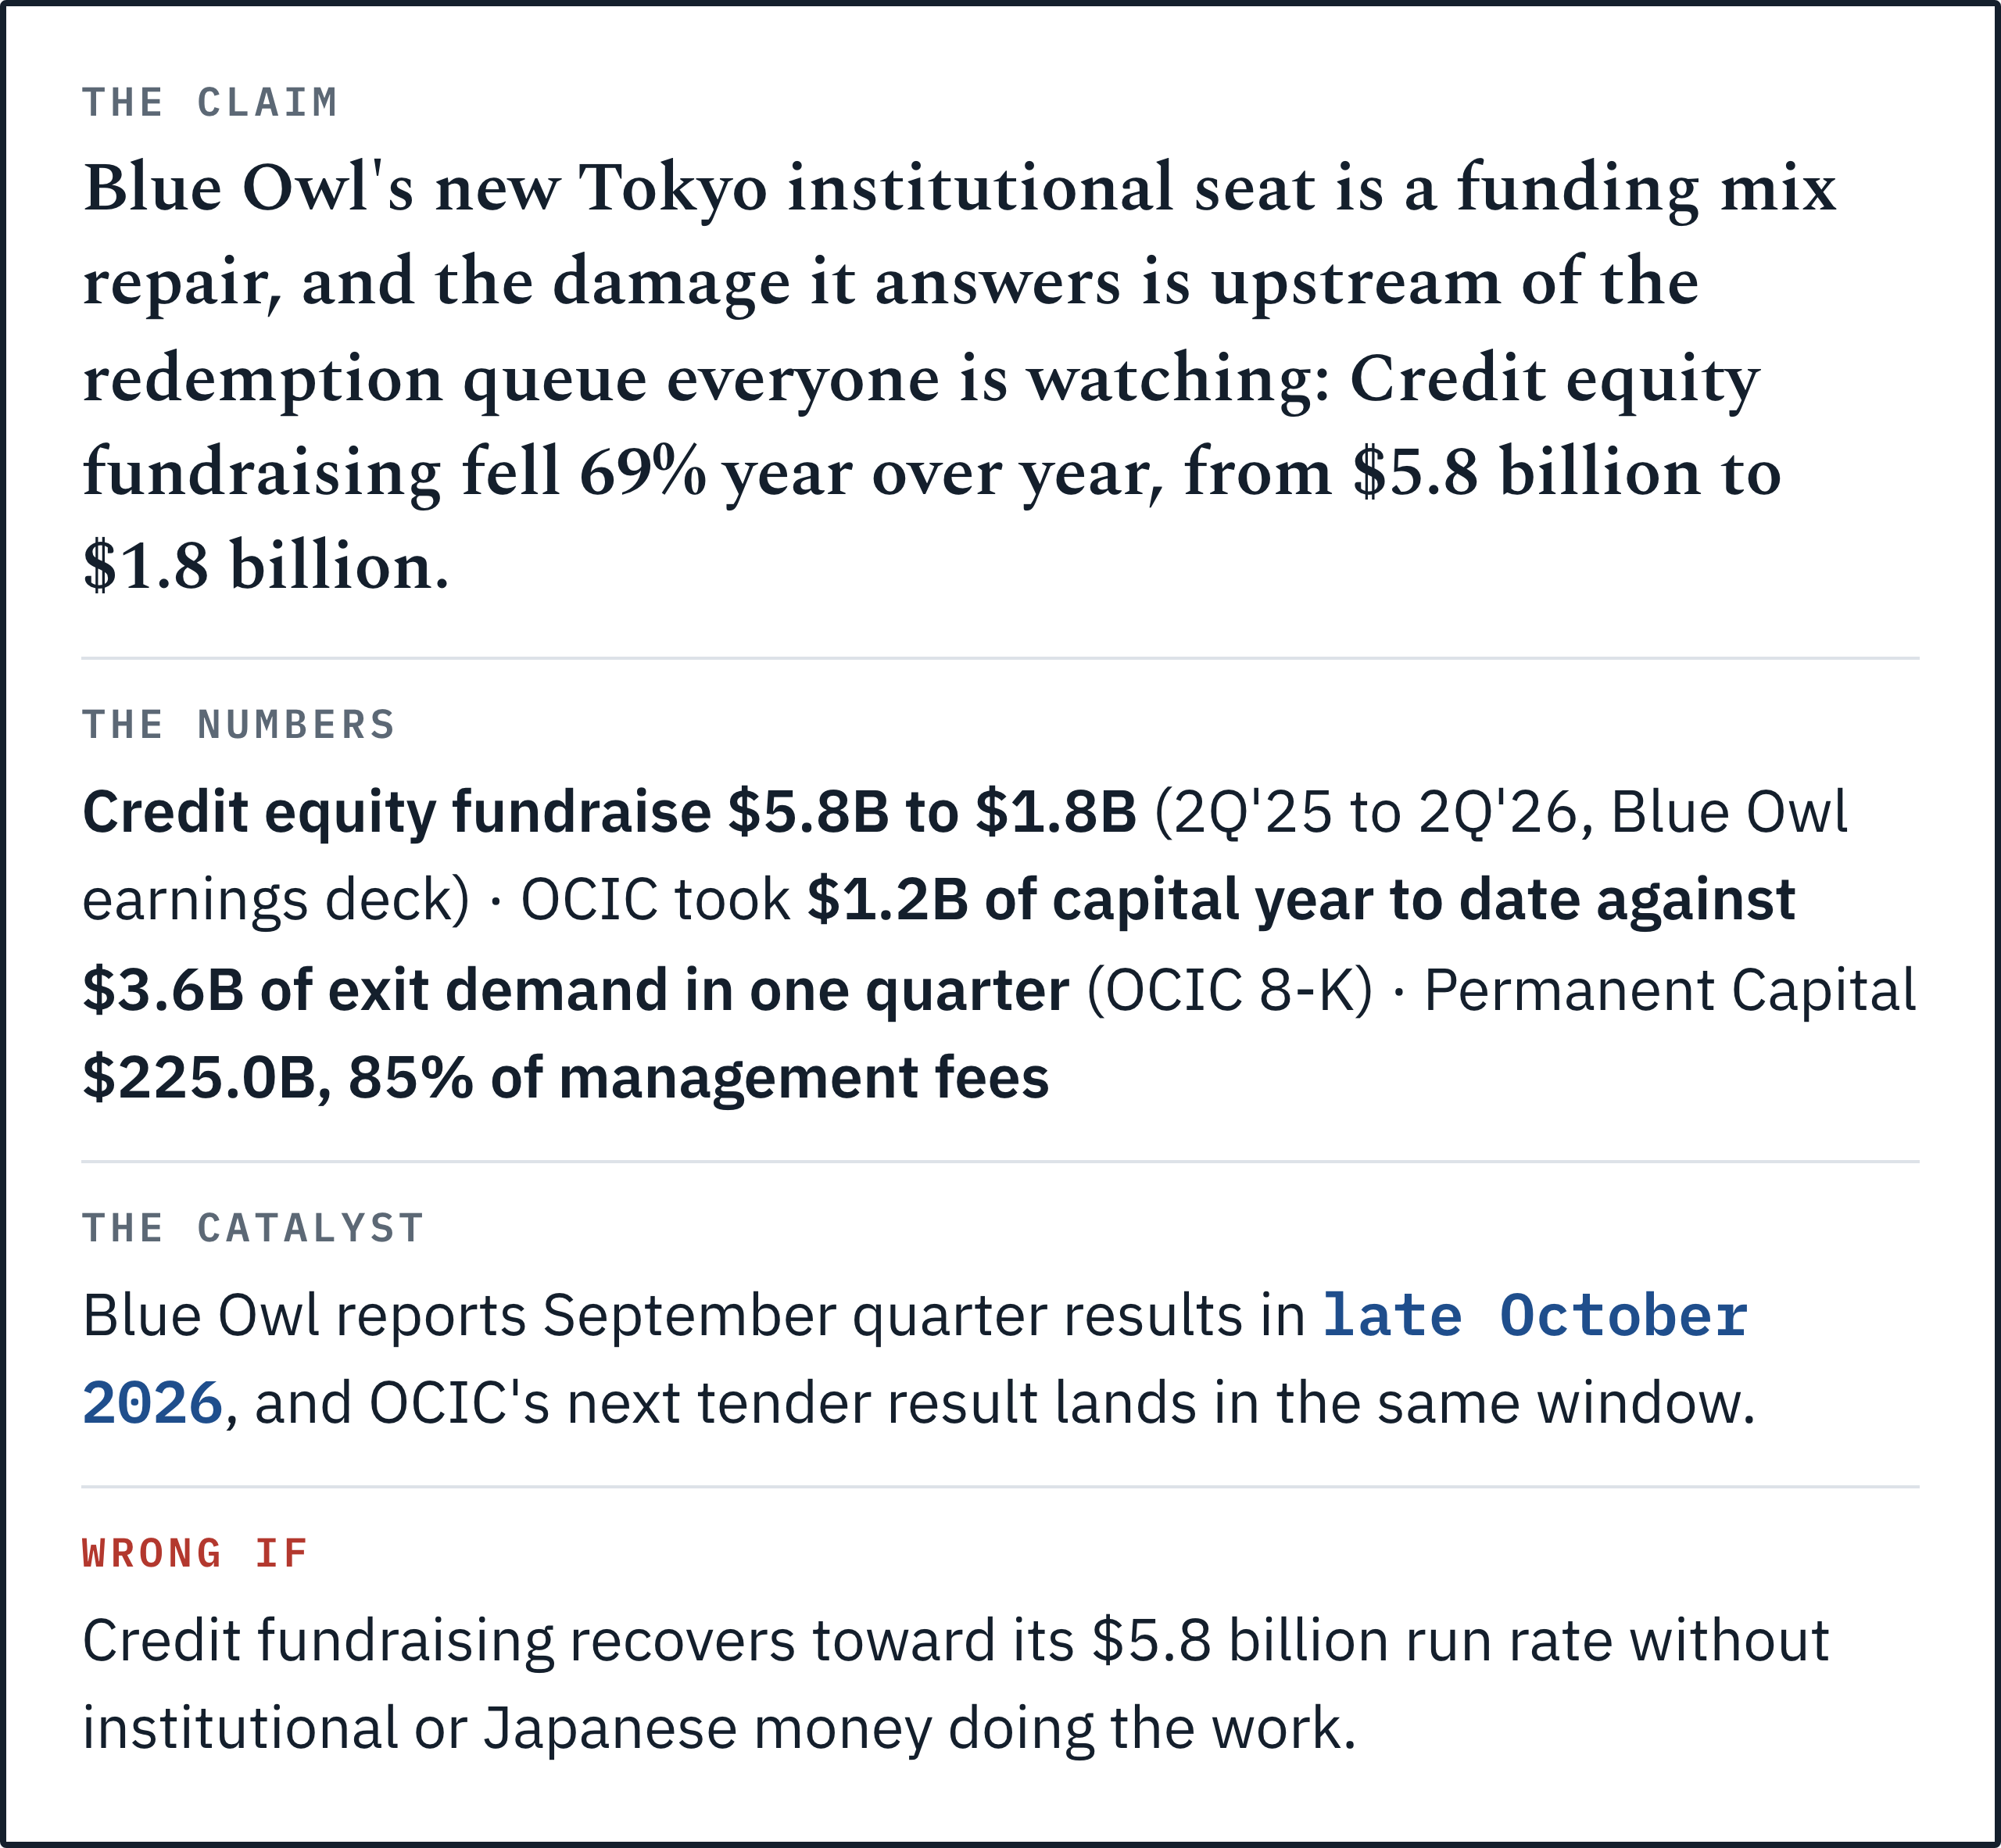
The claim: Blue Owl’s new Tokyo institutional seat is a funding mix repair, and the damage it answers is upstream of the redemption queue everyone is watching: Credit equity fundraising fell 69% year over year, from $5.8 billion to $1.8 billion.
On 2 August, Blue Owl hired Takeo Ikemori into its Tokyo office as head of Japan institutional capital. He spent sixteen years at Barclays and ran Natixis’ financial institutions group in Tokyo before that. He shares the Japan representative role with Yoichi Nakamura, who runs private wealth in the country.
I’ve read maybe forty versions of this story over the years and they all say the same thing. Big American manager opens a seat in Tokyo. Asia is the growth market. Everyone’s doing it.
My problem with that reading is that it’s incurious. It never asks which seat, or what the seat is replacing.
The consensus: Japan at 5-15% against 40% elsewhere
Here is the strongest version of the view I’m departing from, and most of it is simply correct.
Japanese institutions are the most under allocated large pool of capital in the developed world. CJ Morrell of Fiera Capital puts Japanese institutional allocations to private markets at “five per cent to 15 per cent” against “around 40 per cent in Canada, the US and Western Europe,” and describes Japan Inc as “still very much stuck in that 60 per cent debt, 30 per cent equity, 10 per cent hedge fund/alternatives.” He calls it “the very early stages of what I think will be a multi-decade move to embrace private markets.”
The mandate side is moving too. Japan is steering its $1.8 trillion public pension fund toward alternatives, which sat at 1.7% of holdings as of March against a 5% ceiling.
So: enormous pool, structurally under weight, mandate pushing the same direction, a decade of runway. Every large alternatives manager should be staffing Tokyo. Blue Owl’s Co-CEOs said as much in the June quarter release, crediting “the diversification of our business across platforms and geographies.”
I sign all of that. I read it as the right description of Japan and an incomplete description of Blue Owl.
Credit fundraising fell 69% while AUM rose 12%
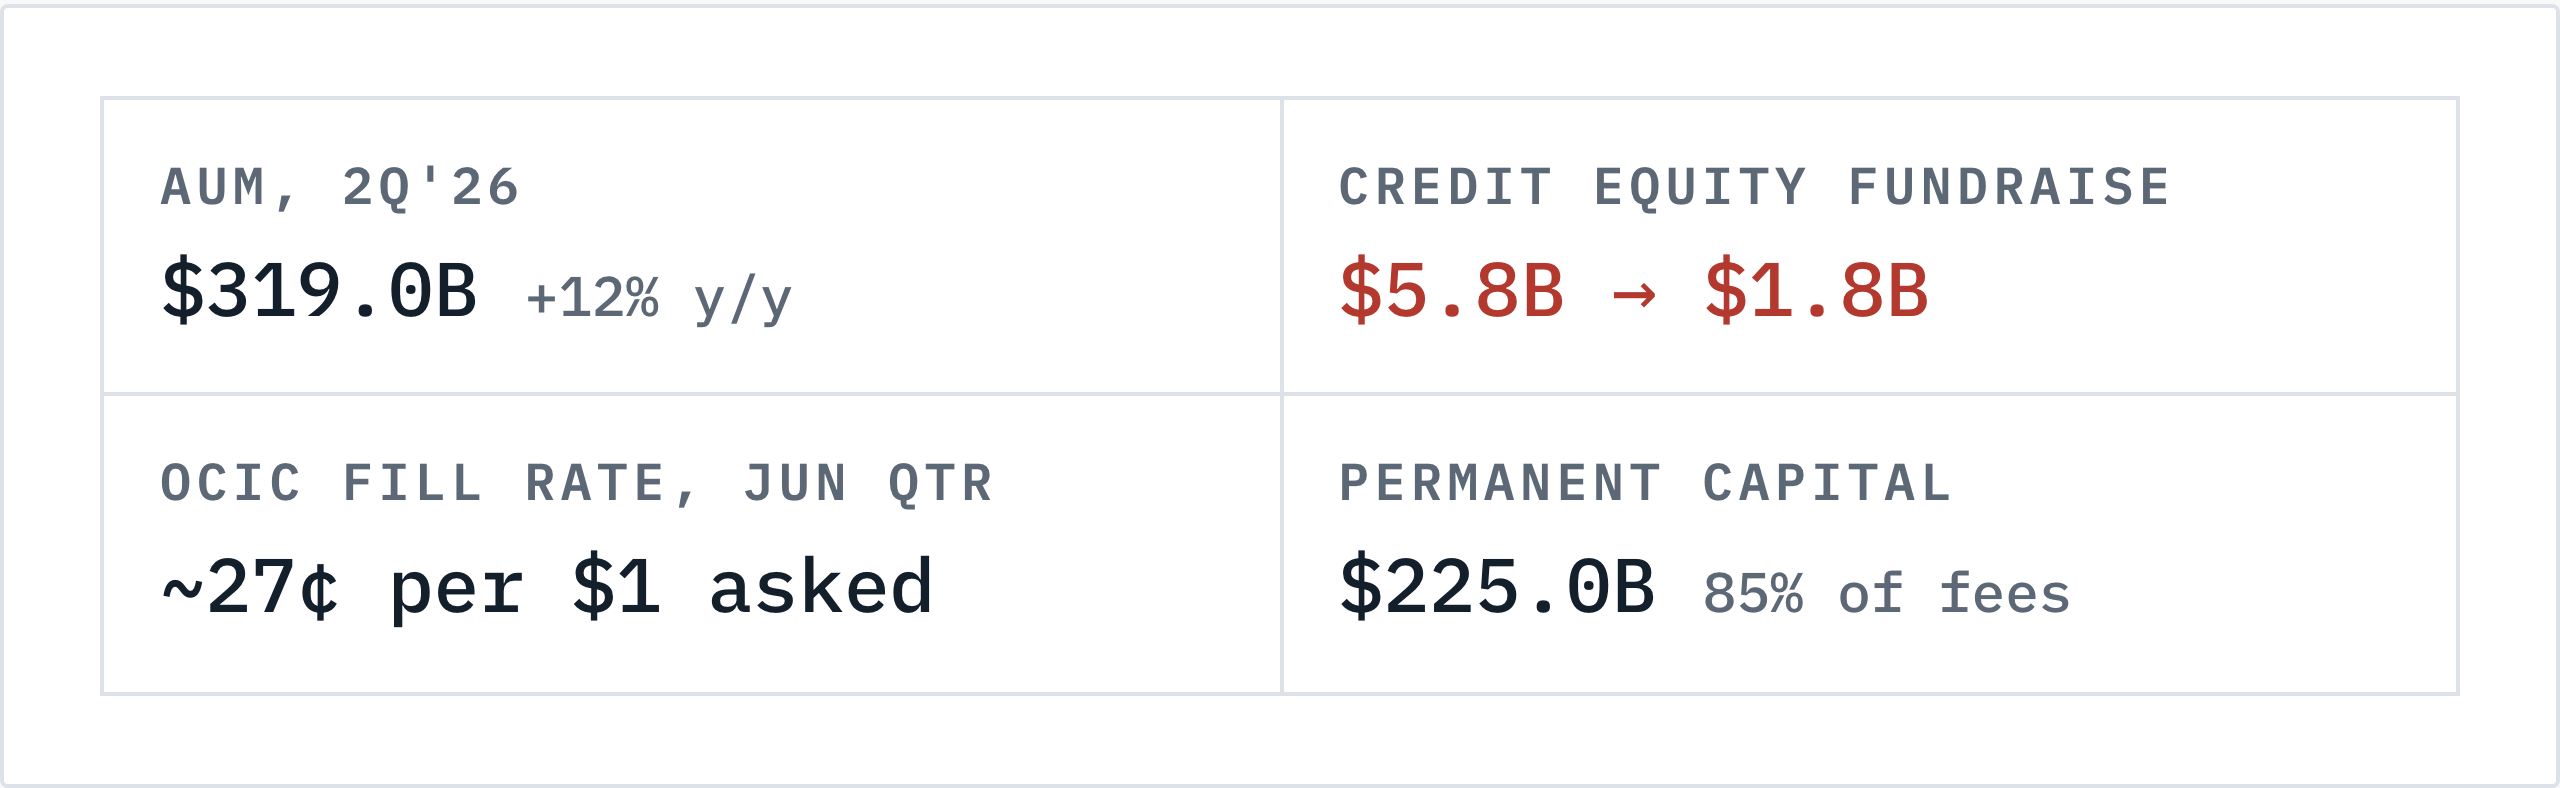
Blue Owl’s June quarter looks fine from the top. AUM reached $319.0 billion, up 12% year over year. Fee-Related Earnings were $392.2 million and Distributable Earnings $351.2 million, both up 9%. The firm declared its $0.23 quarterly dividend.
Now open the fundraising page of the same deck, which is where I think the story sits.
Total equity fundraise was $7.6 billion in the quarter, against $12.1 billion in the June quarter of 2025. That’s a decline of 37% in the rate at which new equity arrives. AUM grew 12% while the intake that produces future AUM fell by more than a third.
Split it by platform and the decline concentrates in one place:
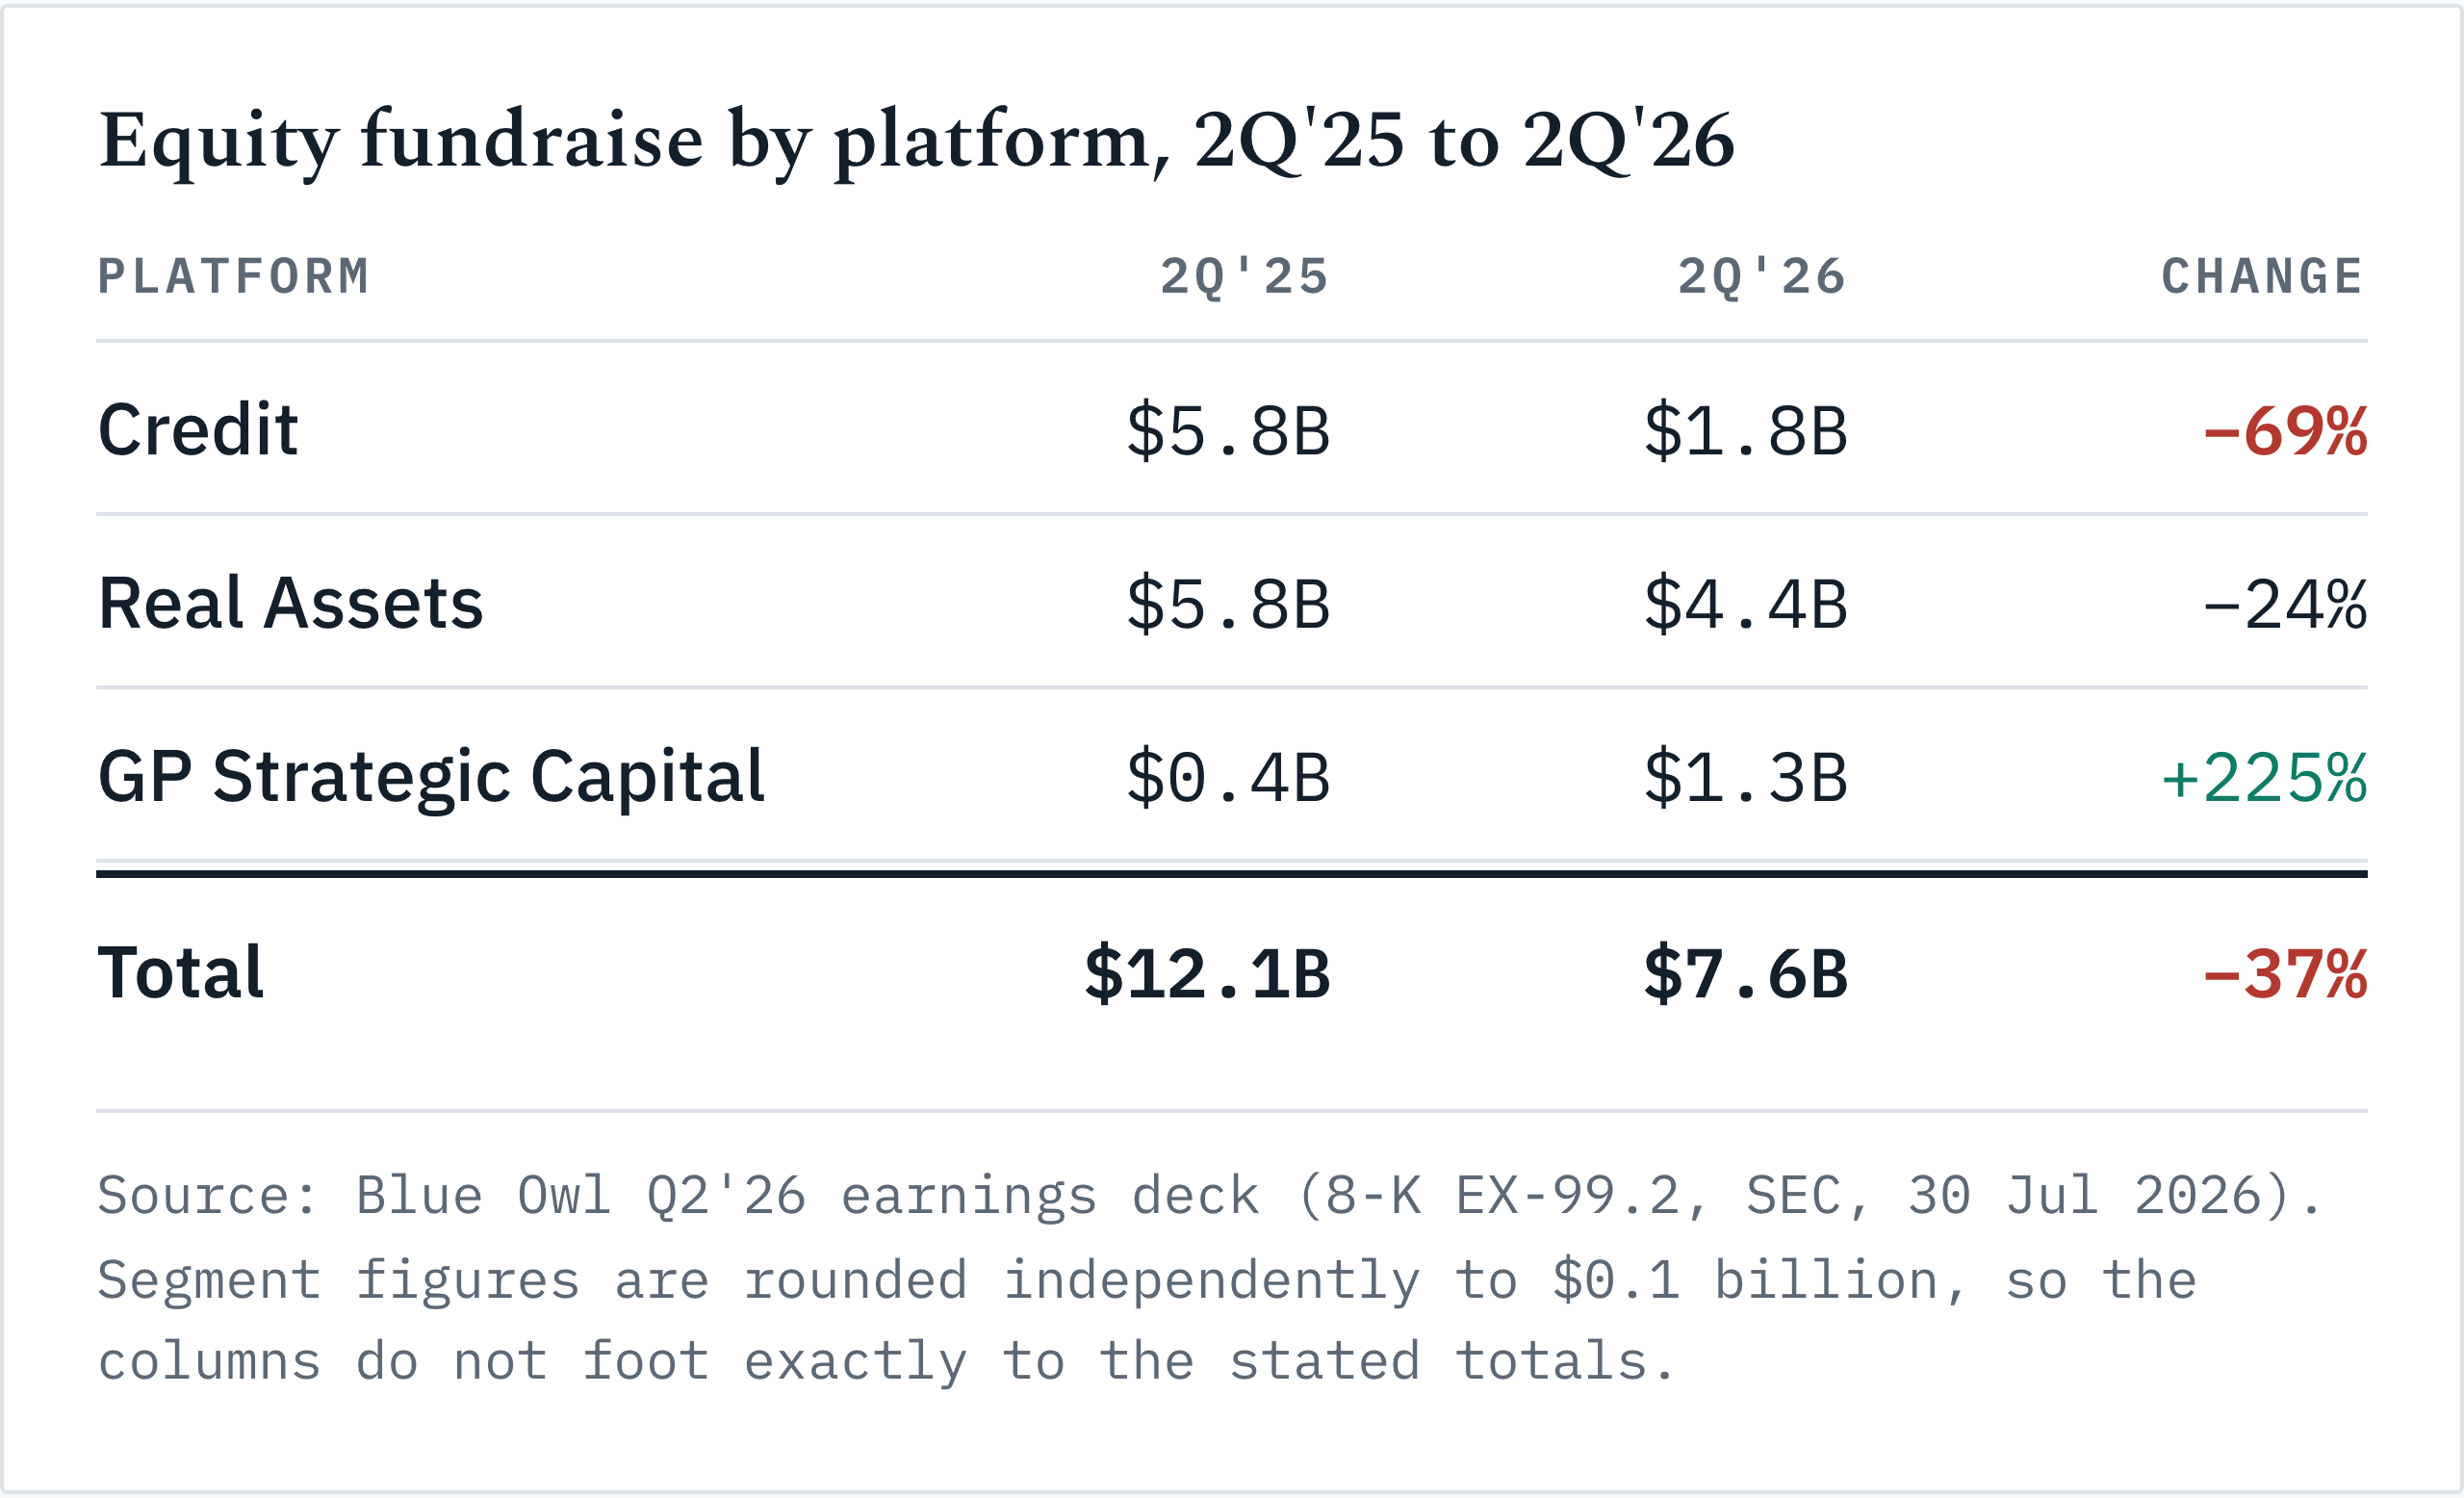
Segment figures are rounded independently to $0.1 billion, so the columns do not foot exactly to the stated totals.
Credit equity fundraising fell 69% year over year, from $5.8 billion to $1.8 billion. Credit is the franchise. It houses the direct lending business, the non traded BDCs, and the brand.
One thing I have to flag before leaning on that number, because it cuts against me: the 2Q’25 base was itself a record quarter for the credit platform. Measuring a soft quarter against a record makes any decline look worse than it would against a trailing average. The fall is real and large on any base I can construct, and it is not as clean as 69% implies.
Split the same quarter by channel and it resolves further. Private wealth equity fundraise was $1.7 billion. Institutional equity fundraise was $5.9 billion. Those add to the $7.6 billion total. On a trailing twelve month basis it runs $13.8 billion private wealth against $26.1 billion institutional.
Institutional money is already carrying roughly three quarters of the intake. I’d note that’s at a firm whose growth story for four years was the wealth channel.
The portfolio is running in place
One more number from the same deck, and I think it’s the most under quoted figure in the release.
Direct lending originations were $3.6 billion in the quarter, and net deployment was $0.6 billion. Over twelve months, originations were $33.2 billion against net deployment of $6.3 billion.
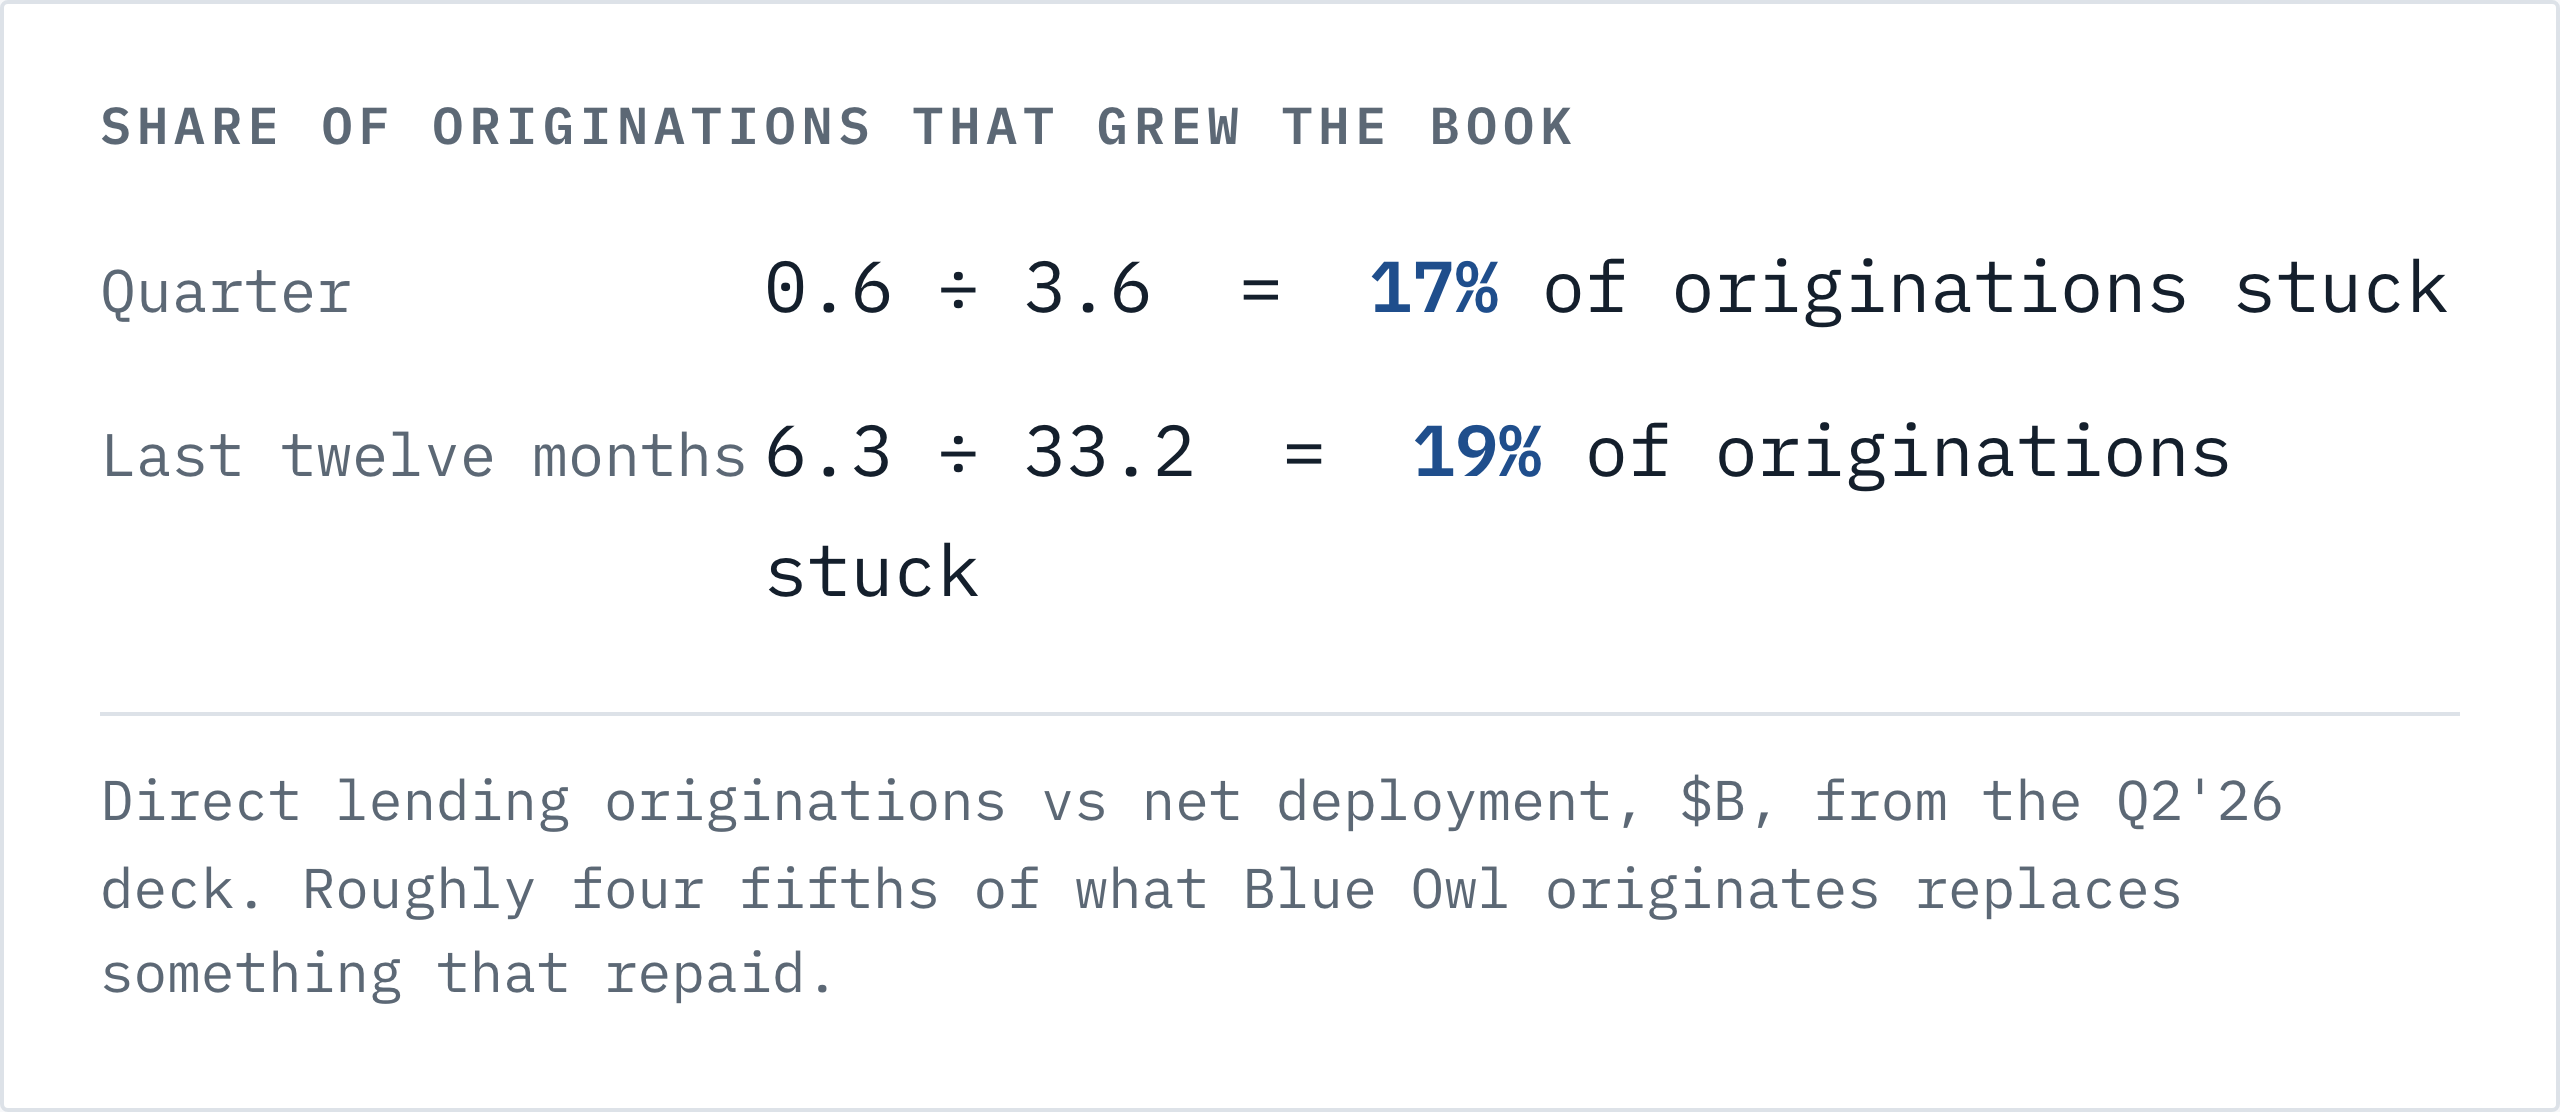
Roughly four fifths of what Blue Owl originates is replacing something that repaid. A lender doing $33 billion of gross origination to grow the book by $6 billion is running hard to stay near the same place. That is not a solvency observation and I don’t want it read as one, because repayments are the healthy way for a credit book to generate liquidity. It’s a growth observation, and it explains where the cash to fill the redemption queue comes from.
The queue, and the arithmetic of 27 cents
Blue Owl Credit Income Corp, the non traded BDC known as OCIC, received $3.6 billion of repurchase requests in the June quarter, down from $4.2 billion in March. Those are 18.8% of shares outstanding, down from 21.9%, against a repurchase cap of 5%.
Work the ratio, because the ratio is the thing.
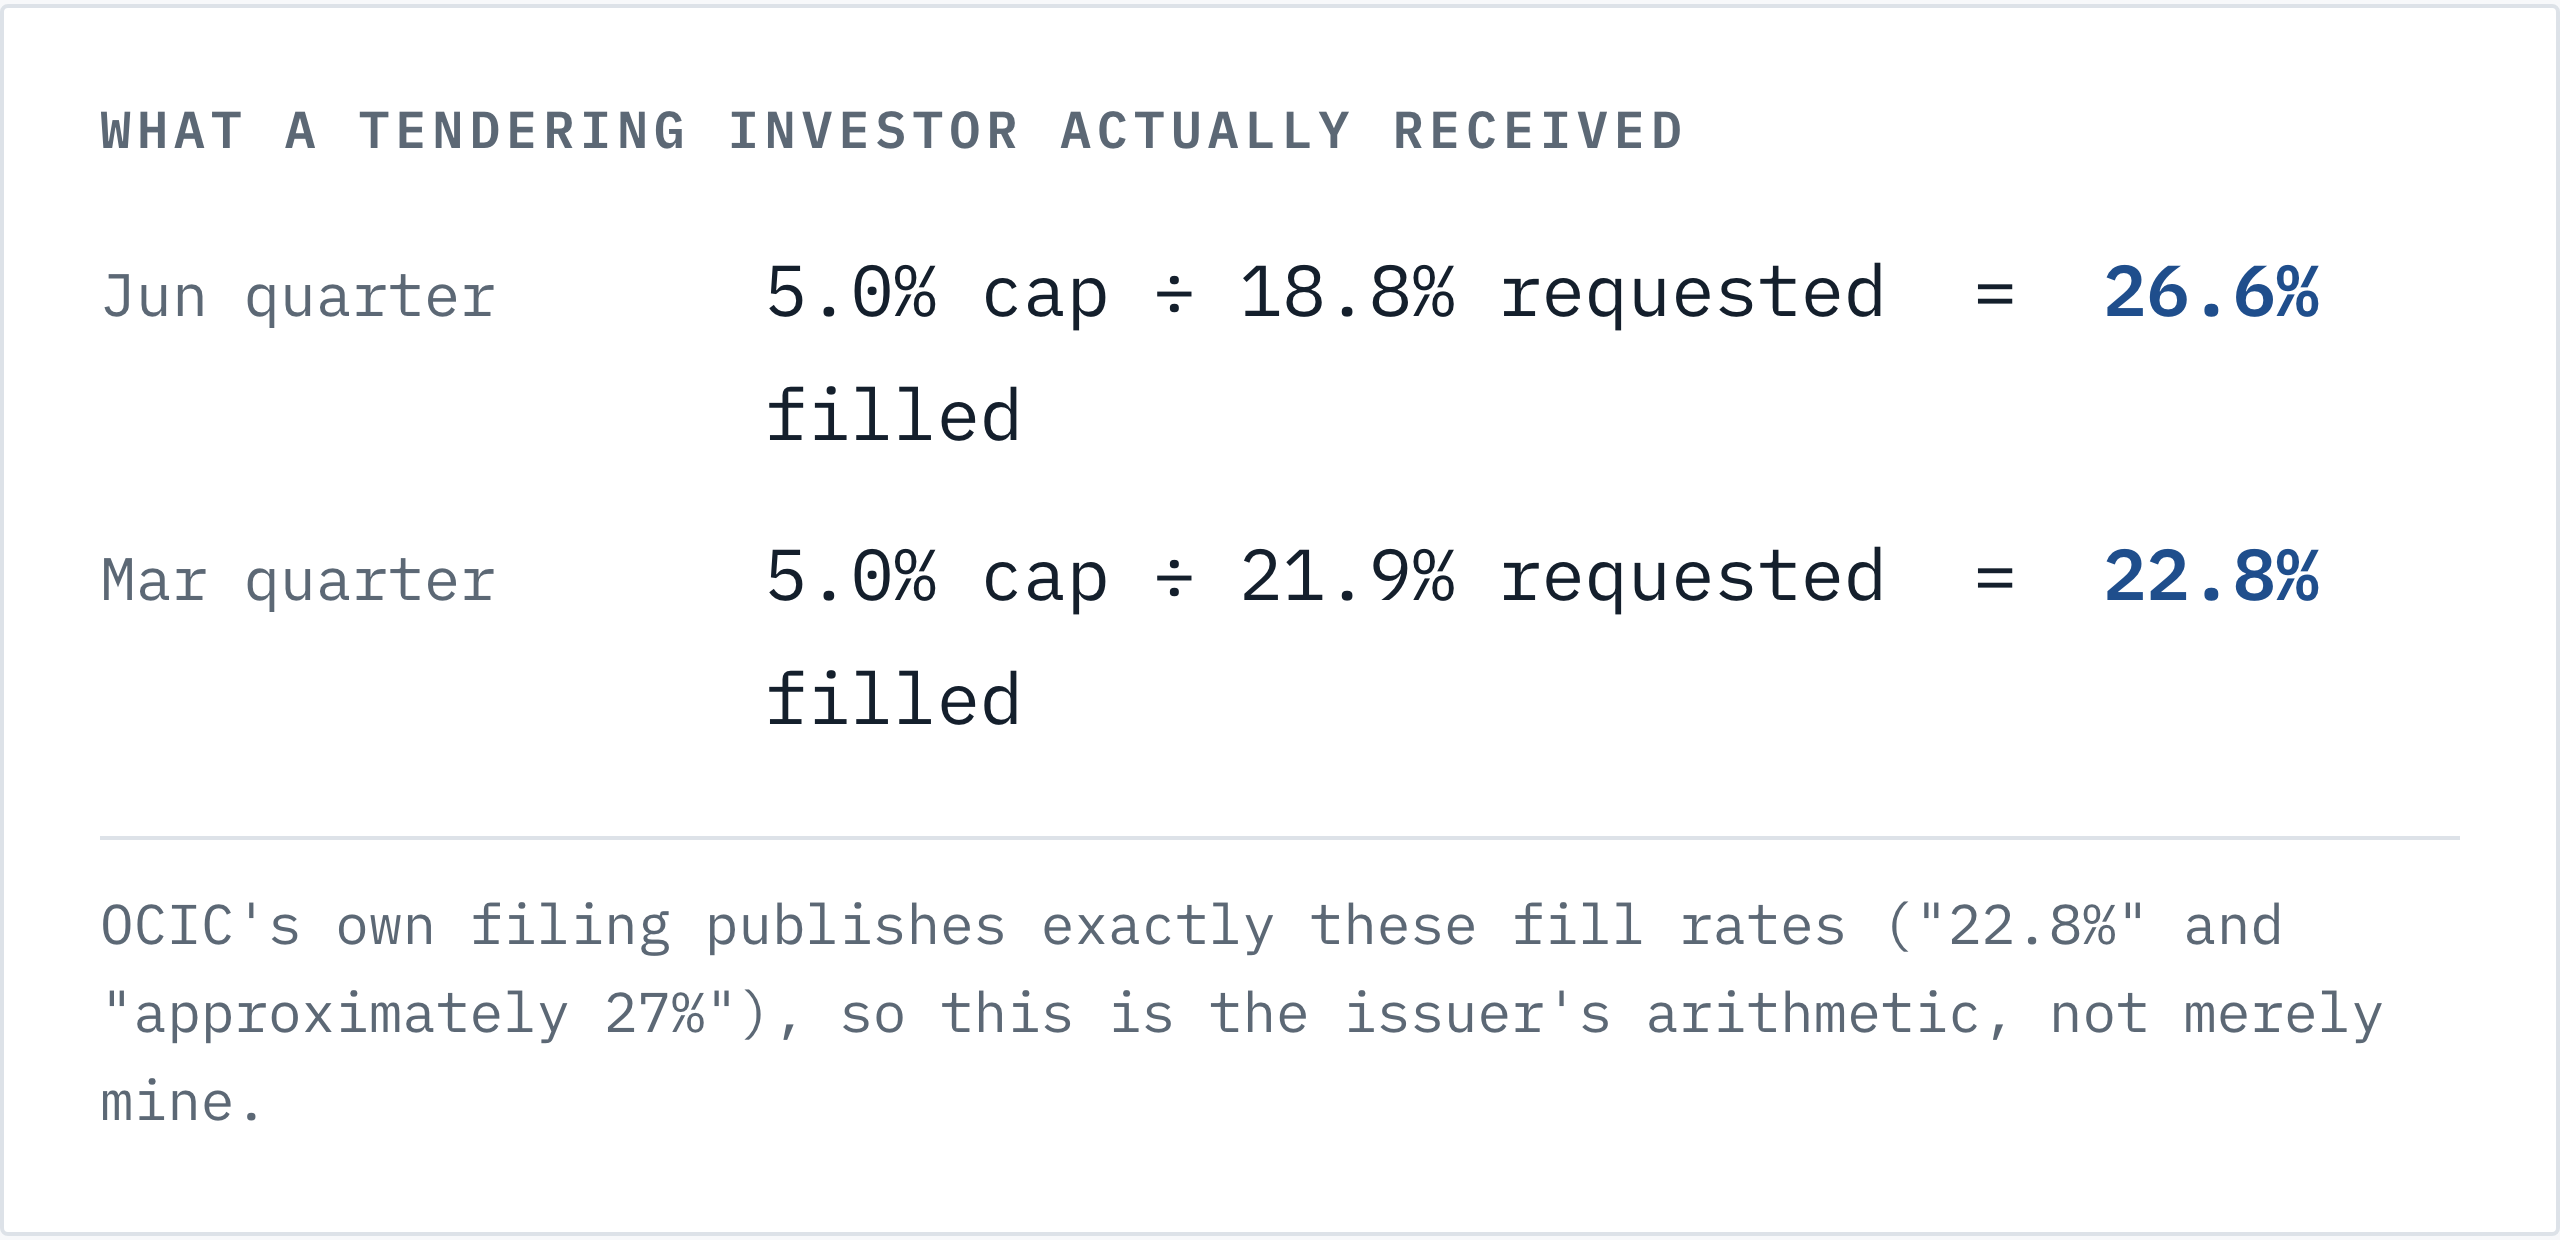
An investor who asked for a dollar back in the June quarter received about 27 cents. In March they received about 23 cents. OCIC’s own filing publishes exactly these fill rates, “representing 22.8% of each shareholder’s tender request” in the first quarter and “approximately 27%” in the second, so this is the issuer’s arithmetic and not merely mine. The improvement is real and I won’t wave it away. It’s also a move from very gated to gated.
Those two percentages let me back out the fund’s size, which Blue Owl does not disclose directly:
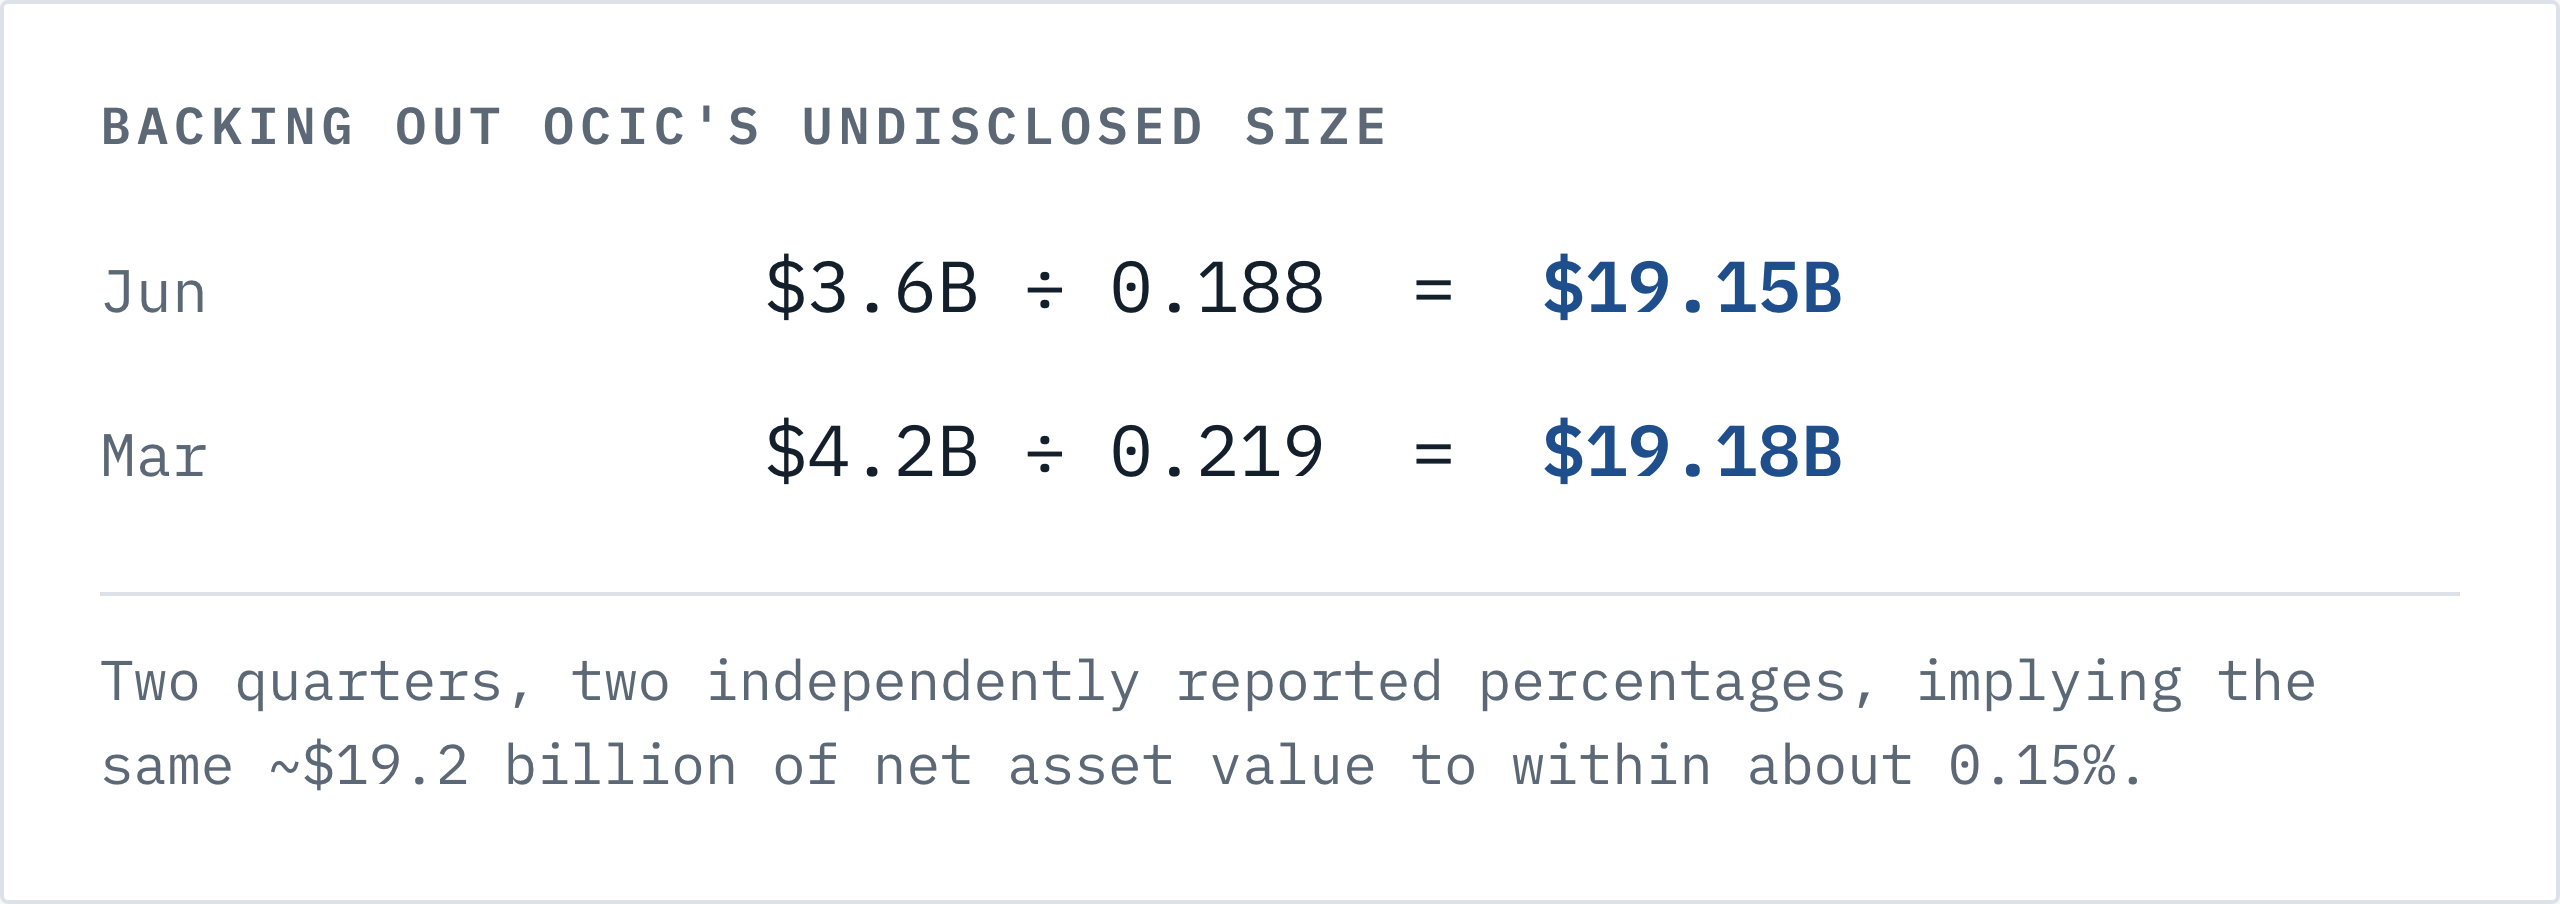
Two quarters, two independently reported percentages, implying the same roughly $19.2 billion of OCIC net asset value to within about 0.15%. A 5% gate on that base is roughly $958 million a quarter of capacity against $3.6 billion of demand.
The number that stopped me is on the other side of the ledger. OCIC has taken in about $1.2 billion of total capital inflows year to date, including roughly $790 million of subscriptions and an estimated $380 million from dividend reinvestment, which the filing itself flags as an estimate. So the fund gathered $1.2 billion across six months while being asked for $3.6 billion back in three. That’s the ratio I keep coming back to.
Blue Owl’s answer to this is worth putting in its own words, because it’s a good one. Quarterly repayments run “typically 6-8% of total assets” against tender offers of 5% of net assets, OCIC has taken $2.7 billion of ordinary course repayments year to date at “approximately 1.4x coverage of share repurchases,” and the fund “does not need to sell a single private loan to satisfy the tender offer.” I accept all of that. It’s an argument about whether the queue is fundable, and my argument is about what the queue does to sales.
This is not a Blue Owl specific failure. Apollo, Ares, Morgan Stanley, HPS, Cliffwater, Monroe and Blackstone all saw requests exceed 5% and held repurchases at the cap. I flagged the structural headwinds in multi strategy funds’ private credit expansion last November, when the strain sat on the manager side rather than the wealth channel. Robert A. Stanger data reported by the Wall Street Journal size it. Investors asked for $15.6 billion back and received $5.9 billion in the June quarter, against $13.9 billion and $7.4 billion in March, while new money into private credit funds fell to around $500 million in May, the smallest inflow in at least eighteen months.
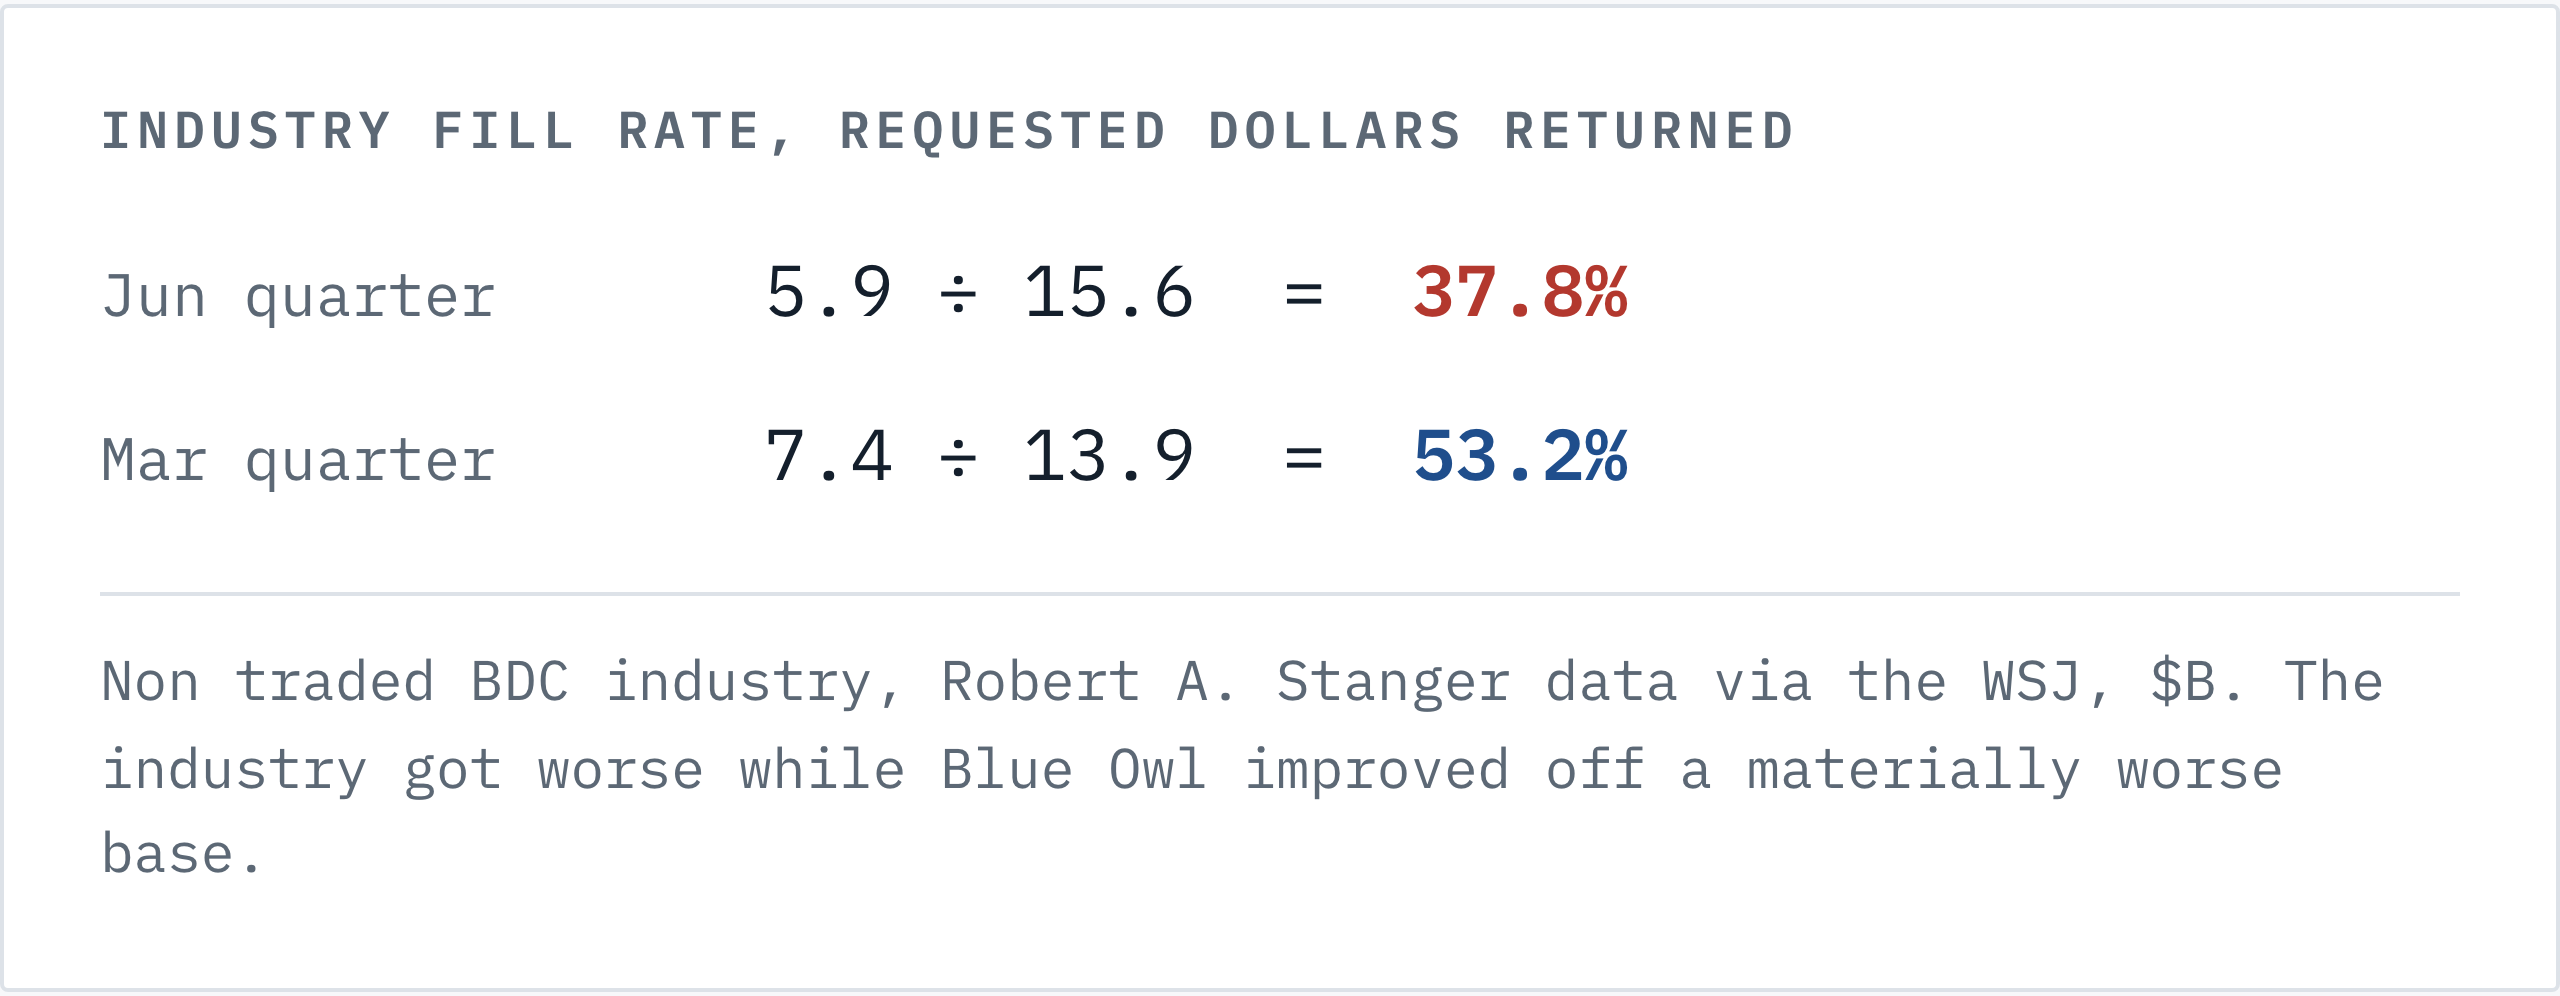
The industry’s fill rate fell from 53% to 38% while Blue Owl’s rose from 23% to 27%. Blue Owl is improving off a base materially worse than its peer group. Oaktree shows the gate can open again: its requests dropped to 4.5% of shares from 8.5%, under the cap, so its queue cleared in full.
On cause, I’d be careful. There is some credit evidence: 6.4% of private credit loans carried “bad PIK” at Q4 2025, interest deferred mid loan under liquidity strain, which Lincoln International treats as a shadow default rate implying distress near 6% against a headline near 2%. But Fitch reads the redemptions as sentiment driven, and the sharper diagnosis in that same analysis is product design: “semi-liquid” was sold as “something meaningfully more accessible than the quarterly cap mechanics permit.” I find that more persuasive, and it matters: a sentiment queue can reverse and a credit queue can’t.
What the gate actually costs, which is less than it looks
Here’s where I have to argue against my own framing, because the obvious next move is to say that 85% of Blue Owl’s fees sit in vehicles with redemption queues, and that would be misleading.
The firm reports Permanent Capital of $225.0 billion and states it generated 85% of FRE management fees over twelve months. Its defined term concedes that permanent capital includes products that “may have periodic tender offers or redemptions.” I thought that was a revelation until I checked the peers. Blackstone, Apollo, Ares and KKR all write functionally the same caveat into their own permanent capital definitions. Blackstone’s 10-K carves out vehicles “where required redemptions are limited in quantum, such as interval funds.” So I read it as industry standard language, and I think anyone selling it as a gotcha is overreaching. I nearly did.
So I sized the actual exposure, which is the part I haven’t seen anyone do. OCIC’s roughly $19.2 billion is about 8.5% of the $225.0 billion permanent capital base. A full quarter at the 5% cap removes about $958 million of NAV. OCIC’s base management fee is 1.25% of net assets annually, charged on equity and not on leverage, so that removes about $12 million of annualised fee income, against $392.2 million of Fee-Related Earnings in the quarter.
So the gate is not an earnings event. Two or three basis points of FRE is noise, and redeemed NAV is partly replaced by fresh origination anyway. What the queue actually does is kill the sales channel. My reasoning is that no adviser puts a client into a vehicle that returned 27 cents on the dollar last quarter, and I’d expect that to show up exactly where it did: $1.8 billion of Credit fundraising where there used to be $5.8 billion. I want to be clear that this step is inference. I have the gate and I have the fundraising collapse, and I do not have an adviser survey sitting between them. The damage is to the growth rate, and the growth rate is what a manager’s multiple is made of.
I’ve written the tradeable half of this argument separately: the Blue Owl gate note on Patreon prices the gate against the fee base and works the October filing sequence the way a desk would.
That reframing is what makes the Tokyo hire legible. Blue Owl doesn’t need Japan to defend this year’s fees. It needs Japan to replace a distribution engine.
The timing lever, which is a rate differential
Japanese institutions finally have yield at home. The 10 year JGB is trading near 2.78%, having touched 2.901%, levels last seen in 1996, up more than 70 basis points this year. The Bank of Japan’s policy rate is 1.00% after a June hike. For the first time in a generation a Japanese institution can buy duration domestically with no credit risk and no hedging cost. On that evidence, funding an American direct lender looks like the worse trade.
The binding constraint on Japanese outbound credit was never the JGB yield. It was the cost of hedging the dollar back to yen, which runs at roughly the short rate differential between the two currencies.
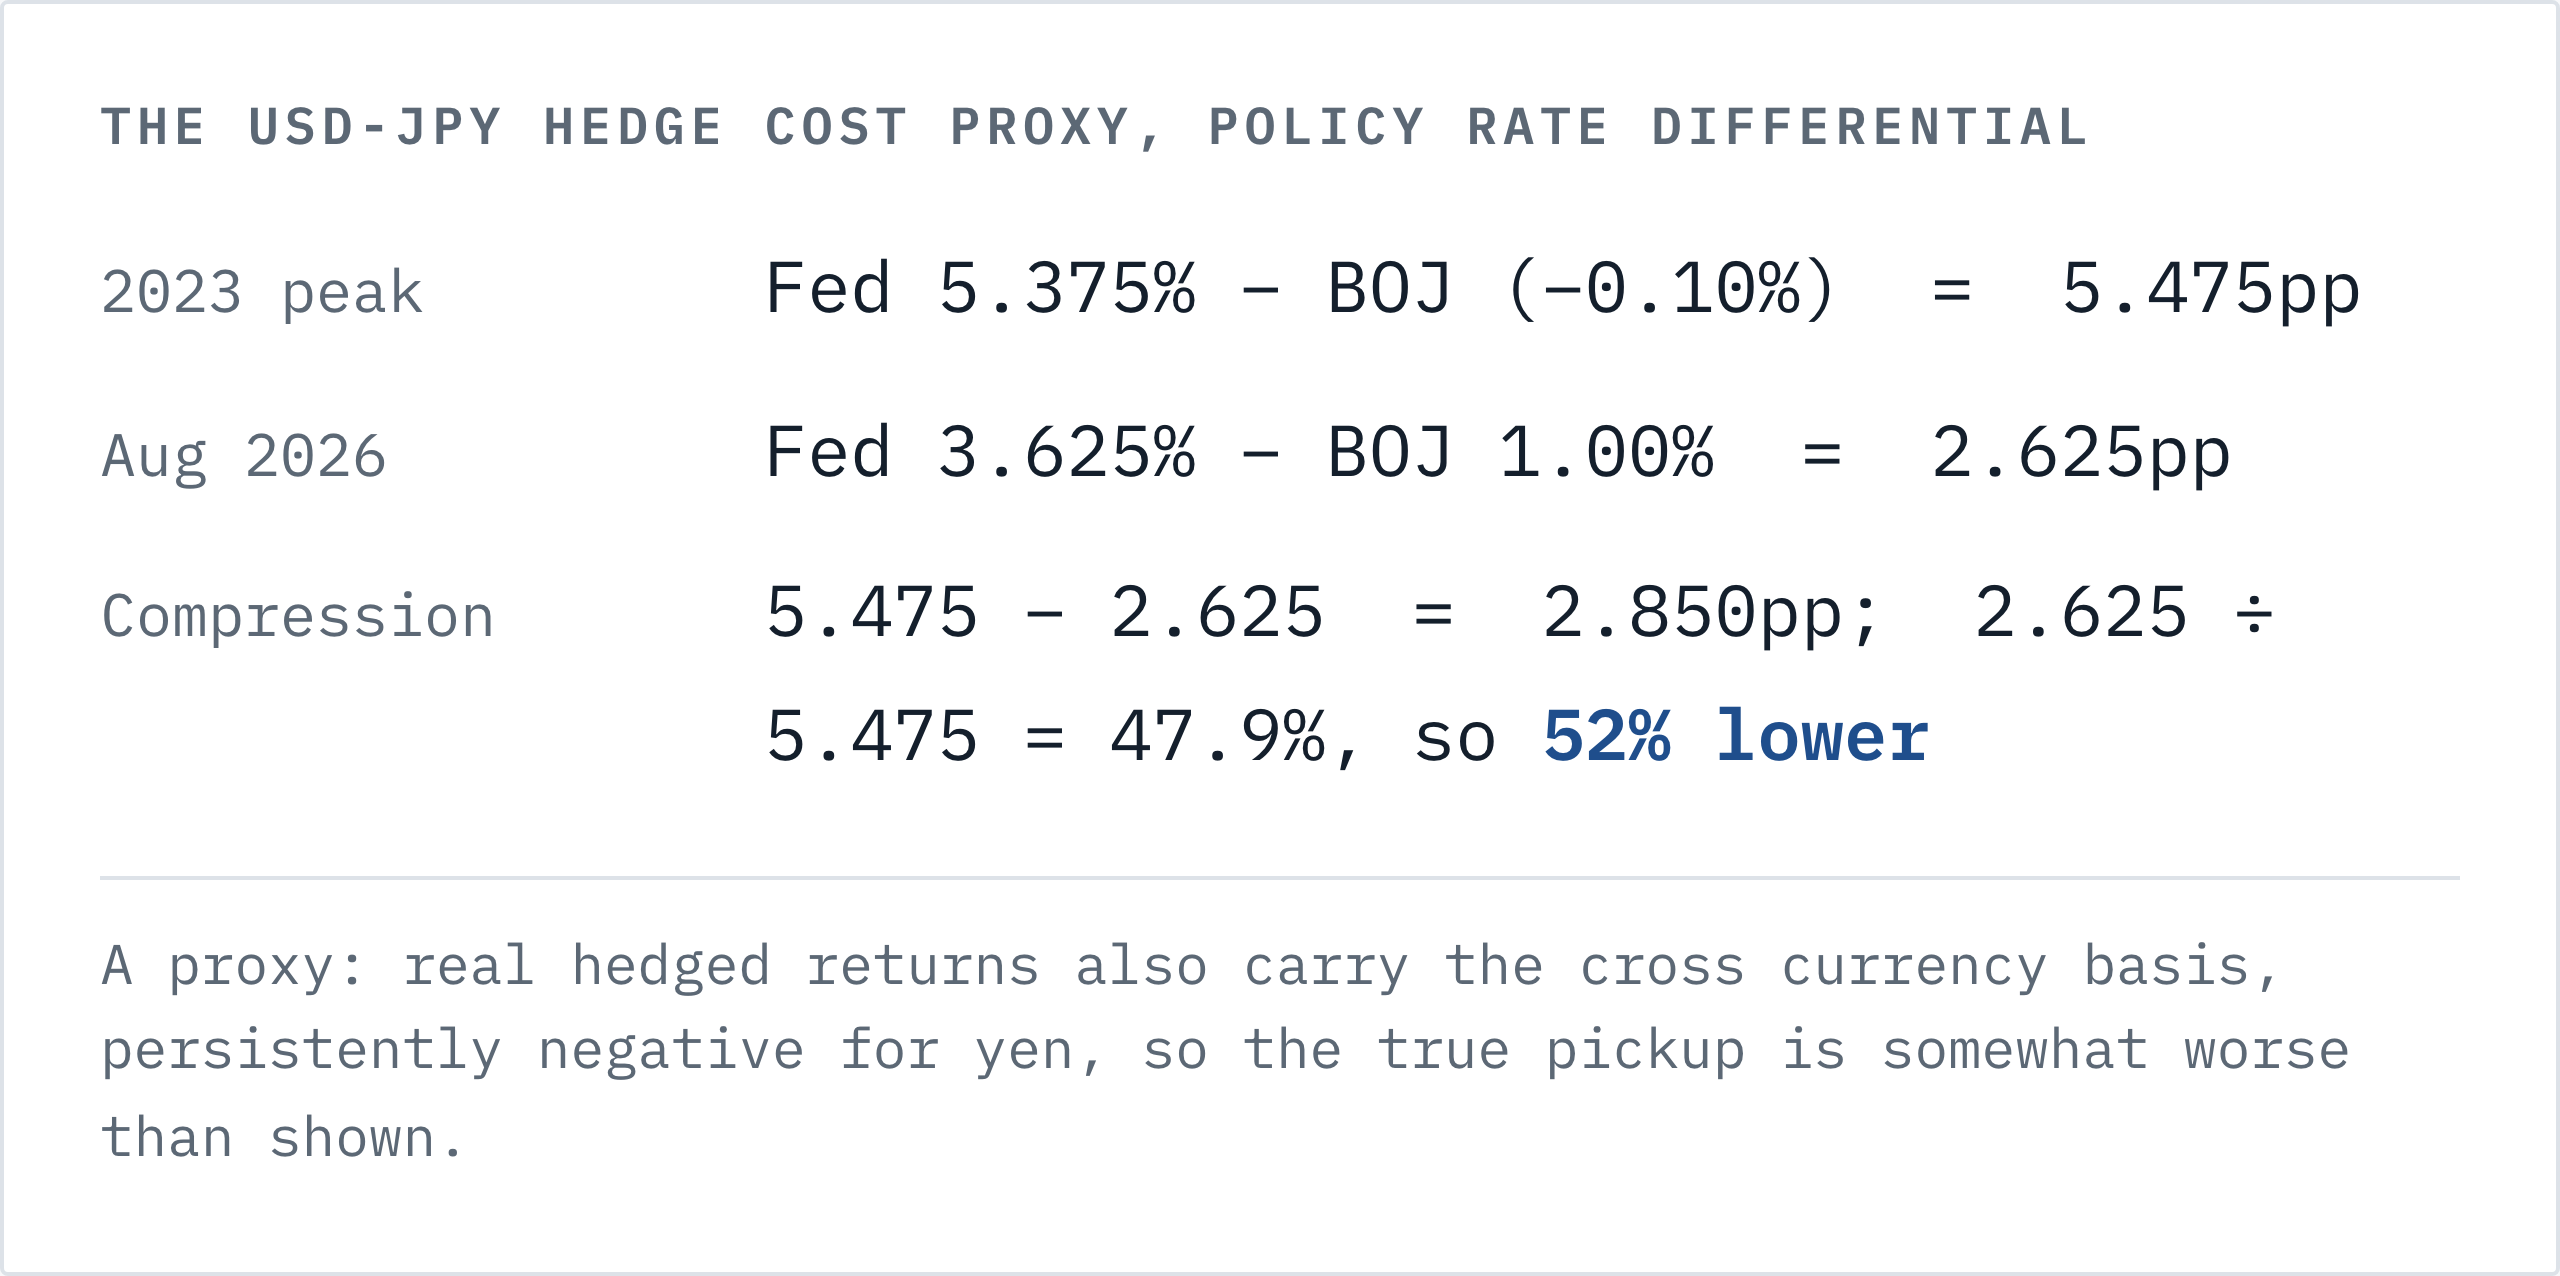
The hedge cost proxy has more than halved, because the Fed cut toward 3.50-3.75% and the BOJ hiked at the same time, from both ends at once.
Two limits on that calculation, and the second is the serious one. The short rate differential is a proxy: real hedged returns also carry the cross currency basis, which is persistently negative for yen and which I can’t observe precisely from public data, so the true pickup is somewhat worse than the proxy implies. And rising JGB yields raise the domestic bar in the same window that hedge costs fall. Both effects are live simultaneously, and the article’s claim is only that the second moved further than the first.
Why Yamamoto’s exit is the weaker of my two discriminators
The rival explanation fits most of these facts. It’s an industry land grab, and the case is stronger than I’d like: Apollo is expanding its Asia private wealth staffing after raising close to $5 billion from wealthy Asian investors, and Ares closed a $2.4 billion Japanese data centre fund in 2025. Tokyo in 2026 is crowded with people making this trip. Blue Owl also launched an insurance solutions platform in 2024 and hired a leader for it in May 2026, so a firm wide institutional pivot predates this hire by two years.
Two things still discriminate, and neither is decisive alone.
Blue Owl is backfilling. Takeshi Yamamoto was a managing director at Blue Owl Japan. In April he left to become head of capital formation for Japan at Benefit Street Partners, Franklin Templeton’s private credit arm, where he now argues publicly that “private credit is at a clear inflection point” and that Japanese institutional investors “have been under allocated compared to their global peers.” I’d weigh this less heavily than I first wanted to. Senior Tokyo coverage bankers are being poached across the sector right now, and I think a four month search for an outside hire is ordinary.
The seat is institutional and separate. Nakamura runs private wealth, and has since he joined from Algebris. Ikemori’s book is banks and insurers: he led coverage of Japan’s largest financial institutions at Barclays and ran financial institutions at Natixis Tokyo. Splitting Japan into a wealth seat and an institutional seat, and filling the institutional one with a balance sheet banker, is a statement about which pocket the firm now underwrites.
Four things I can’t rule out
I cannot prove the Credit collapse is a wealth channel story. Blue Owl publishes fundraising by platform and fundraising by channel, and it does not publish the intersection. So I can show that Credit intake fell 69% and that wealth intake is small, and I cannot show from the disclosures that the fall happened in the wealth channel. Institutional pullback from direct lending would fit the same two tables. This is the weakest joint in the argument and I’d rather name it than let a reader find it.
The money may not be fungible into the hole. This is the objection I’d lead with if I were arguing against myself. Nothing guarantees Japanese institutional dollars land in the direct lending sleeve that’s bleeding. Ikemori’s stated mandate spans private credit, real estate and GP stakes, and Blue Owl’s institutional inflows this quarter went to net lease, real estate credit, investment grade credit, direct lending and GP minority stakes, which is a mix. Japan could diversify the institutional base without ever touching OCIC’s problem.
Global LPs are rotating away from exactly this product. A 2026 Rede Partners survey found roughly 70% of institutional LPs expect to diversify beyond direct lending, with only a small minority planning to increase mid market direct lending allocations, citing spread compression and underwriting standards. That is a structural headwind to the institutional bid, and it is independent of anything Blue Owl did.
Japanese money is currently going the other way. Japanese investors were net sellers of foreign bonds on a large scale in early 2026 as domestic yields rose, and GPIF has signalled its alternatives build will tilt toward domestic projects. I take that seriously: the repatriation trend is real, and it cuts directly against a story about Japanese capital funding American credit.
The causal arrow may point the other way. Japan may be the next market on a plan drawn in 2023 when the Tokyo office opened, with the funding stress a coincidence of timing. I can’t see the internal calendar. And the clocks don’t match: a relationship led institutional build in Japan takes years, while the fundraising hole is quarterly.
What would change this view: the late-October print
Blue Owl reports September quarter results in late October 2026, with OCIC’s tender result in the same window.
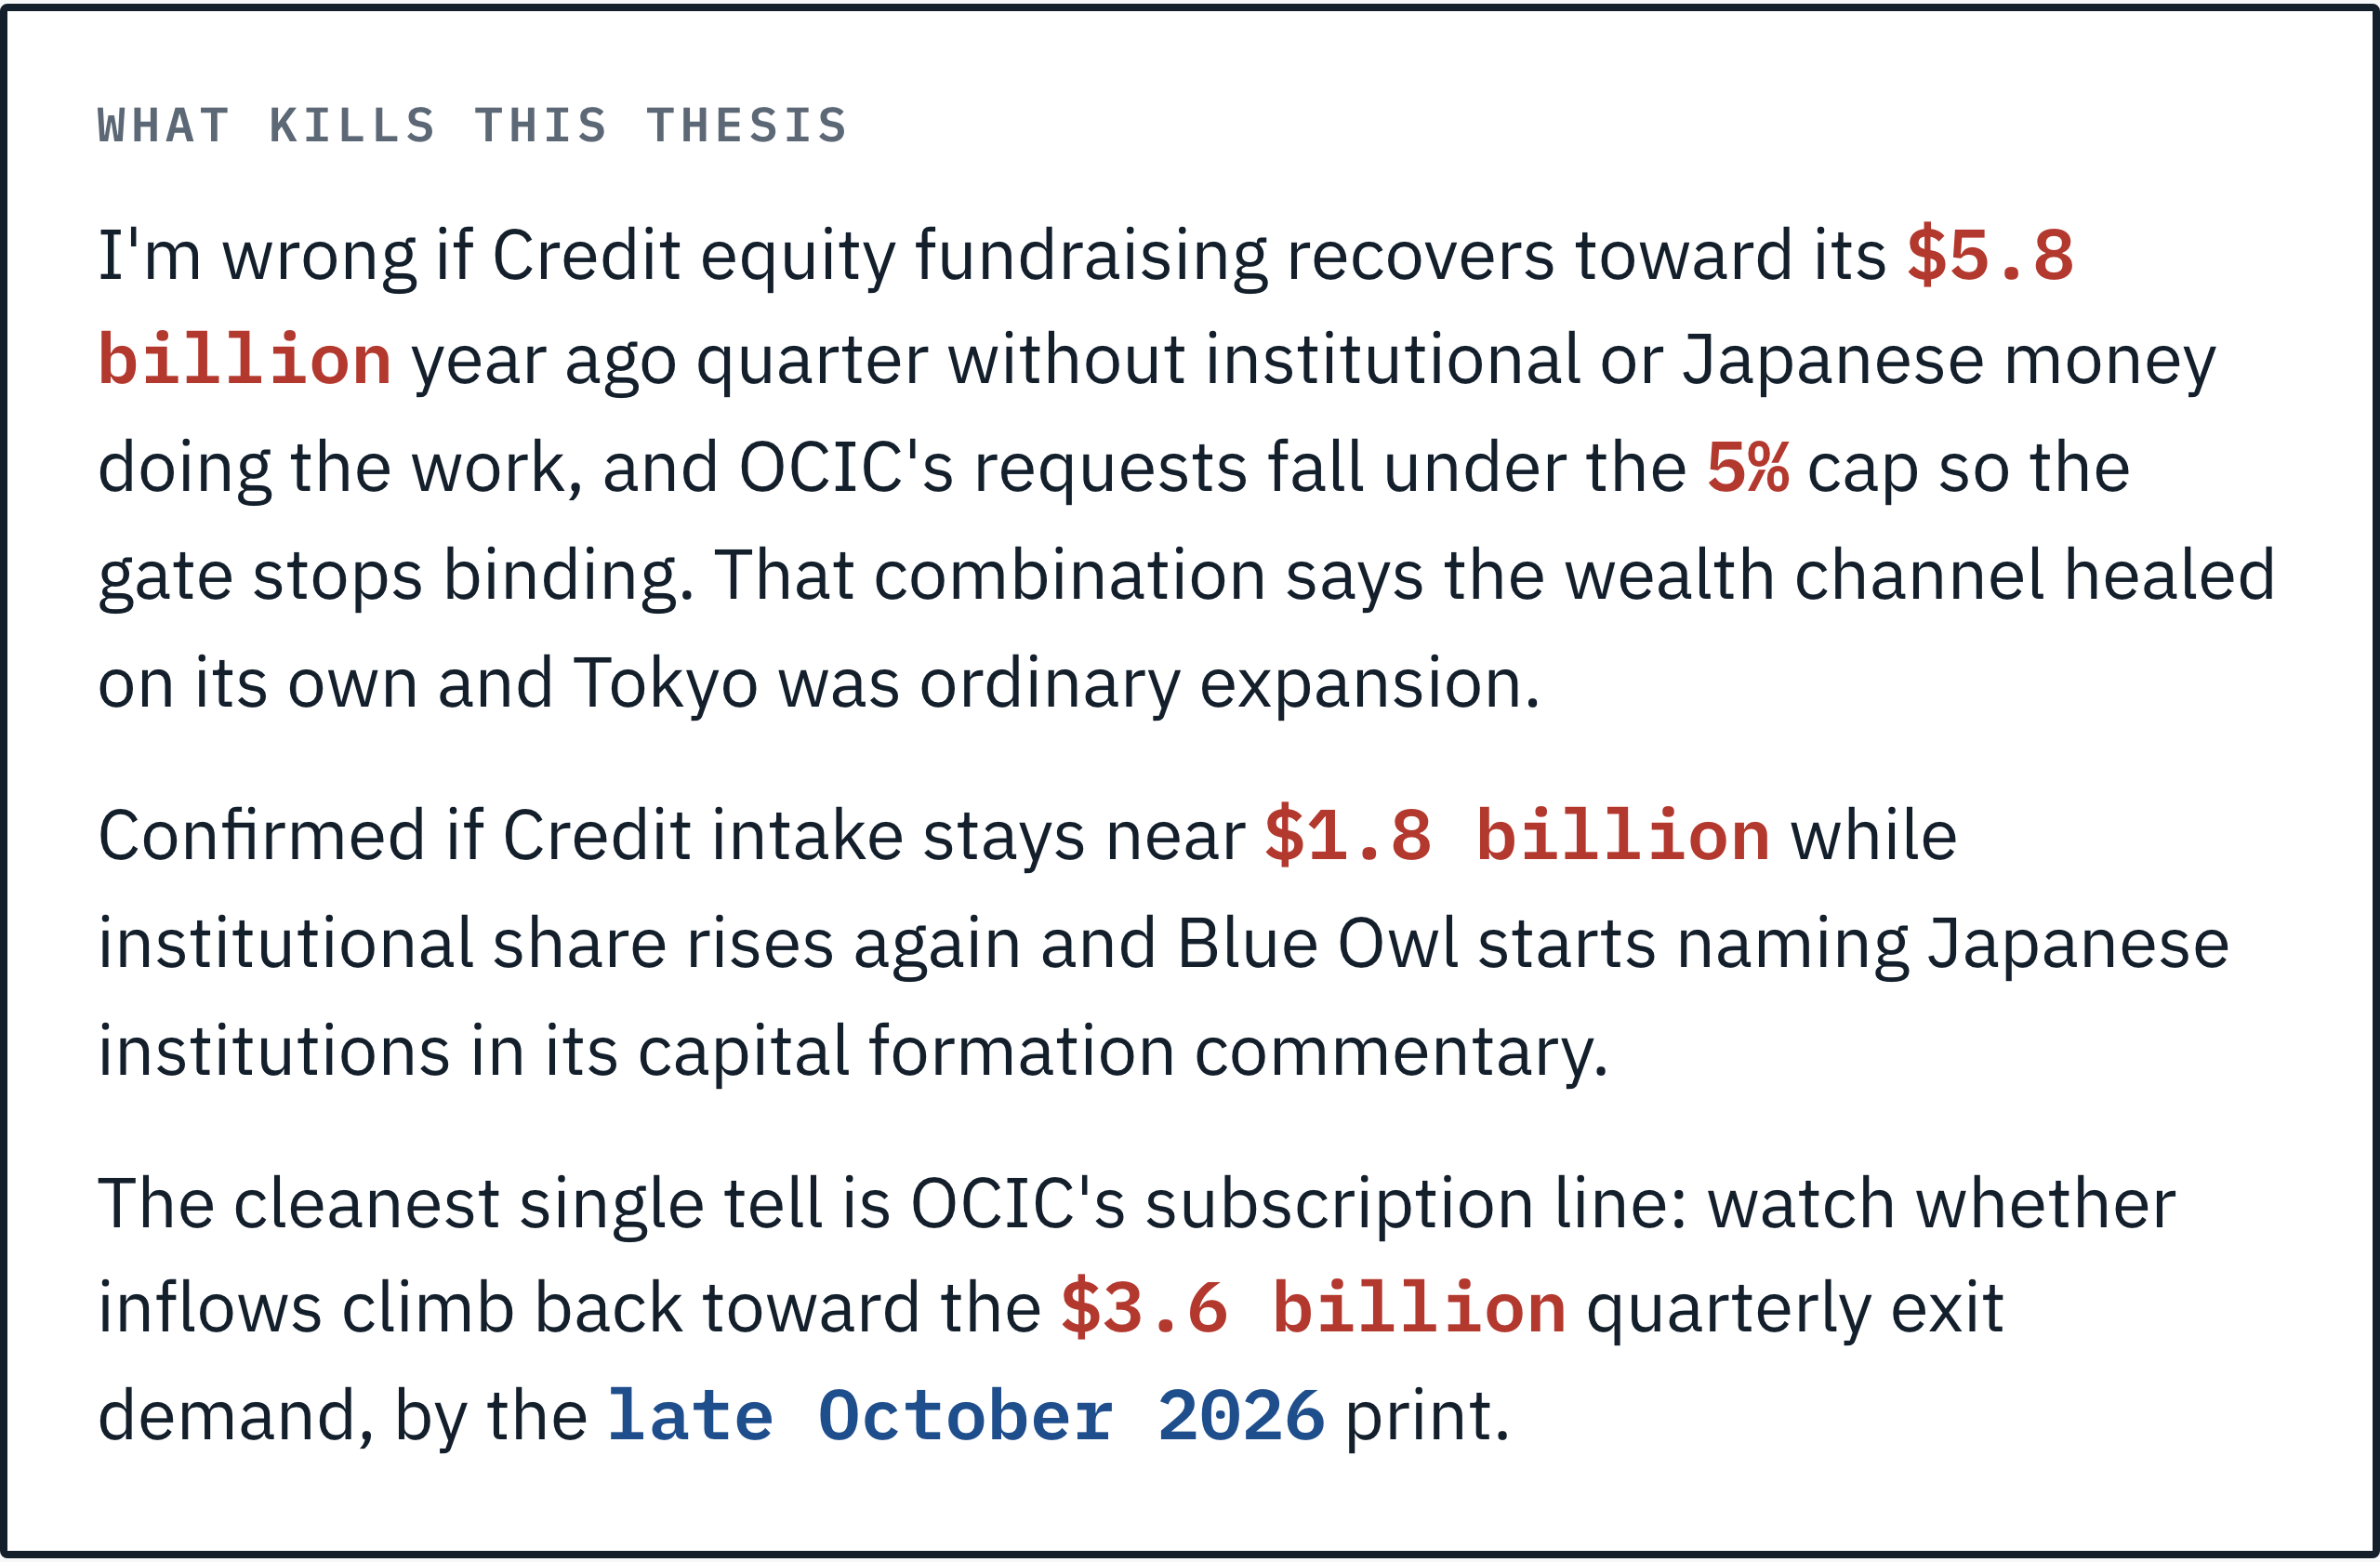
I’m wrong if Credit equity fundraising recovers toward its $5.8 billion year ago quarter without institutional or Japanese money doing the work, and OCIC’s requests fall under the 5% cap so the gate stops binding. That combination says the wealth channel healed on its own and Tokyo was ordinary expansion.
I’d count it confirmed if Credit intake stays near $1.8 billion while institutional share rises again and Blue Owl starts naming Japanese institutions in its capital formation commentary.
The cleanest single tell is OCIC’s subscription line. Watch whether inflows climb back toward the $3.6 billion quarterly exit demand. That gap, not the fee line, is the thing that has to close.
What I’d actually do with this
If you own OWL, stop underwriting the redemption queue as an earnings risk. It isn’t one, and the arithmetic above says so. Underwrite the distribution risk instead: the wealth channel that produced $5.8 billion of Credit equity a year ago produced $1.8 billion last quarter, and no plausible Japanese institutional ramp replaces $4 billion a quarter within a year. The stock fell 68.2% from its January 2025 peak of $25.02 to $7.95 on 2 April 2026, so the market has priced something. I can’t tell yet whether it priced a fee cut that isn’t coming or a growth rate that is actually broken. That’s the question I’d want answered before I sized anything.
If you’re a credit allocator, note that the whole industry’s wealth channel is gated at 5% at once. That makes the marginal buyer of US direct lending paper more likely to be an insurance or balance sheet account than an American wealth platform. Balance sheet money prices differently and holds through drawdowns that would trigger a retail queue.
If you’re competing for the same Japanese capital, the hedge cost window is a rate differential and rate differentials close.
I covered Blue Owl’s OBDC merger termination and its NAV discount in February, when the pressure sat in one vehicle and read as a governance problem. Six months on I read it as a distribution problem, which is a different and larger thing.
So here’s the question I’d put to anyone who underwrites managers for a living. OCIC gathered $1.2 billion in six months while being asked for $3.6 billion back in three. At what ratio does a perpetual vehicle stop being a growth engine and start being a runoff book? I don’t think Blue Owl is near that line. I do think it’s the only line that matters now, and I haven’t seen anyone put a number on it.
📊 The Decision-Grade Version
This piece is complete on its own. The thesis, the evidence, the confounds and the dates that would kill the view are all above. Nothing was held back to sell you a next step.
The Patreon note is a separate piece of work. It takes one decision from inside this story: pricing the redemption gate against the fee base, timed to the October tender print that lands four weeks before Blue Owl reports. It writes that the way a desk would act on it, with the arithmetic shown, the crowding constraint sized, and the outcomes that confirm or kill the read. Written for people who put capital behind a view.
→ Read the Blue Owl gate trade note
→ Or join the Patreon community for every note
Elsewhere: YouTube for the video breakdowns, and LinkedIn for the shorter reads.
Cover photograph: Ajay Suresh, CC BY 4.0, via Wikimedia Commons.