


The collapse of Technology/Media/Telecom hedge fund differentiation from equity benchmarks is not a bad streak. It is the predictable endpoint of a capacity overflow: when a single fund’s AUM exceeds the entire prior TMT universe, the long book is structurally forced into the same mega-cap names that define the Nasdaq 100. The alpha erosion is documented, the mechanism is causal, and the fee structure is indefensible at scale.

The Technology/Media/Telecom hedge fund category carried a 0.99 beta to the S&P 500 in April 2026 — the highest of all 40 categories PivotalPath tracked, and tied with readings from February and March 2026 as among the highest in the firm’s 26-year dataset. In that same month, the average TMT fund came within 16 basis points of the S&P’s monthly return, the closest match ever recorded across those 40 categories. The 18-month rolling correlation to both the S&P and the Nasdaq is 0.96.
When the world’s most specialized tech equity managers collectively deliver S&P beta within rounding error, the 2-and-20 fee model requires a cleaner defense than “we pick stocks.” This piece argues that defense does not exist — not because these managers are poor at stock selection, but because capacity overflow has removed the portfolio space in which their selection could produce returns uncorrelated to index performance. The practical implication is direct: an allocator paying 2-and-20 to a TMT hedge fund above roughly $10 billion in AUM is, in most cases, paying premium fees for Nasdaq beta rather than for alpha. The mechanism, the alpha decay, and the approximate capacity bound at which the remaining edge survives are all documentable.
🎬 Prefer to watch rather than read? A NotebookLM-generated video overview of this article is available here: Watch the video overview → Full analysis, citations, and data remain in the article below.
Note on PivotalPath data used throughout: PivotalPath’s own publications state that the firm tracks over 3,000 institutionally-relevant hedge funds spanning more than $3 trillion in global hedge fund capital. Their indices over-represent larger, established funds relative to the full industry.
The Beta Arithmetic
PivotalPath, as reported in Institutional Investor (May 27, 2026), found the TMT Index’s 18-month rolling beta to the S&P 500 at 0.99, with correlation to both the S&P and the Nasdaq at 0.96. The historical baseline makes the shift legible: from 2000 through late 2024, the average TMT beta to the S&P 500 was 0.40 and, on a rolling basis, never exceeded 0.50 except during the 2008 financial crisis. Jon Caplis, CEO of PivotalPath: “at the end of 2024 when technology funds steadily went from roughly .5 to close to 1 right now.”
The implied Nasdaq beta requires one derivation step. Given TMT correlation to Nasdaq of 0.96 and the reported beta to the S&P of 0.99, the implied TMT volatility relative to the S&P is:
σ_TMT / σ_S&P = β_S&P / ρ(TMT, S&P) = 0.99 / 0.96 = 1.031
Nasdaq Global Indexes’ Q4 2025 research paper (data through December 31, 2025, 18-year period) reports Nasdaq-100 annualized volatility of 22.9% and S&P 500 annualized volatility of 20.1% — a ratio of 1.139. Applying this:
β_Nasdaq = ρ(TMT, Nasdaq) × (σ_TMT / σ_Nasdaq) = 0.96 × (1.031 / 1.139) ≈ 0.87
Important sensitivity note — and why it only runs one direction. The 18-year long-run vol ratio (1.139) is the only verified, publicly available figure; the 18-month period over which PivotalPath measured TMT correlation and beta does not have a published realized vol breakdown. In the AI rally regime — particularly 2024, when the Nasdaq returned 25.9% versus the S&P’s 25.0% — Nasdaq and S&P co-moved more tightly than their historical average, likely compressing the recent-period vol ratio. If the current-regime ratio is approximately 1.05 rather than 1.139, then β_Nasdaq ≈ 0.94, not 0.87. The sensitivity runs in only one direction: a compressed recent-period vol ratio implies a higher Nasdaq beta, which makes gross alpha more negative, not less. The table below uses 0.87 as the conservative floor; if 0.94 is closer to the truth, Coatue’s 2024 gross alpha is −5.6pp rather than −3.8pp.
The composite correlation data extends well beyond tech specialists. PivotalPath’s October 2025 market risk alert, as reported by Axios, found the 12-month composite hedge fund correlation to the S&P at 0.955 — the 99th percentile of historical readings. Multi-strategy funds show 0.819 correlation to the S&P, at the 98th percentile. Event-driven funds, per Crain Currency/Pensions & Investments, reached 0.99, against a historical mean of 0.79.
The Mechanism: Position Scale Removes the Alpha Surface
The failure mode is structural. A TMT fund managing $59 billion in discretionary AUM (Coatue’s Form ADV filed March 2024, as reported by Insider Monkey) constructing a 40-name long book at 2.5% average weight requires approximately $1.5 billion per position. That size is viable only in companies with market capitalizations well above $100 billion — which is to say, the Nasdaq 100’s largest names. The “tech selection” alpha Coatue’s analysts can generate on mid-cap names cannot be expressed at meaningful portfolio weight at $59B AUM. The long book is anchored in the same mega-cap AI names that define the index.
A second mechanism amplifies the first: diversification across managers does not escape the problem at the portfolio level. PivotalPath’s credit index runs 0.94 correlation to the S&P 500 over the prior 12 months, while average individual credit managers show approximately half the index-level reading. The AI factor is present in each manager’s book at a moderate level; when an allocator combines multiple managers seeking diversification, the shared AI exposure reappears in aggregate. Diversification across correlated managers reconstructs the benchmark.
The 1998 Mirror: This Has Happened Before
Brunnermeier and Nagel’s 2004 academic paper, examining 53 hedge fund managers’ quarterly SEC 13F filings from 1998 to 2000, found systematic technology overweighting throughout the Nasdaq’s ascent. [13F filings capture long US equity positions at quarter-end only; they do not capture short positions, derivatives, or international holdings. The directional overweighting finding is treated as valid for the long book.] At the Nasdaq’s March 2000 peak, the sample held 31% of stock portfolios in technology against a market weight of 21%. The funds were not hedging the bubble — and their long books did not protect against the 55% Nasdaq 100 drawdown that followed.
The current exposure structure is directionally comparable. The Goldman Sachs equity strategy team, per Institutional Investor’s reporting, found that top tech stocks accounted for 53% of S&P 500 total returns in 2024. Goldman Sachs prime brokerage data, reported by Reuters and confirmed by Hedgeweek, showed hedge funds’ exposure to AI-related tech hardware at its highest since Goldman began tracking the data in 2016, as of October 2025. (Goldman prime brokerage data covers Goldman’s client universe, not the full industry.)
The 1998 parallel is not a prediction of a comparable drawdown. It is a structural analogy: both episodes show a concentrated equity market reducing the diversification surface for any discretionary long manager — and a hedge fund industry that, individually rationally, declined to run tracking error against the dominant factor.
The Coatue Arithmetic: A Case Study in Fee-Loaded Beta Negative
Institutional Investor’s 24th Annual Rich List — which ranked managers by personal 2024 earnings: Englander ($4B), Griffin ($3.3B), Cohen ($3.2B), then Laffont ($1.9B) at fourth — reported that Philippe Laffont’s Coatue Management gained 18.7% in its main long-short fund in 2024. The Nasdaq 100 returned 25.88% that year per Invesco, the index licensor.
Applying the conservative β_Nasdaq floor of 0.87:
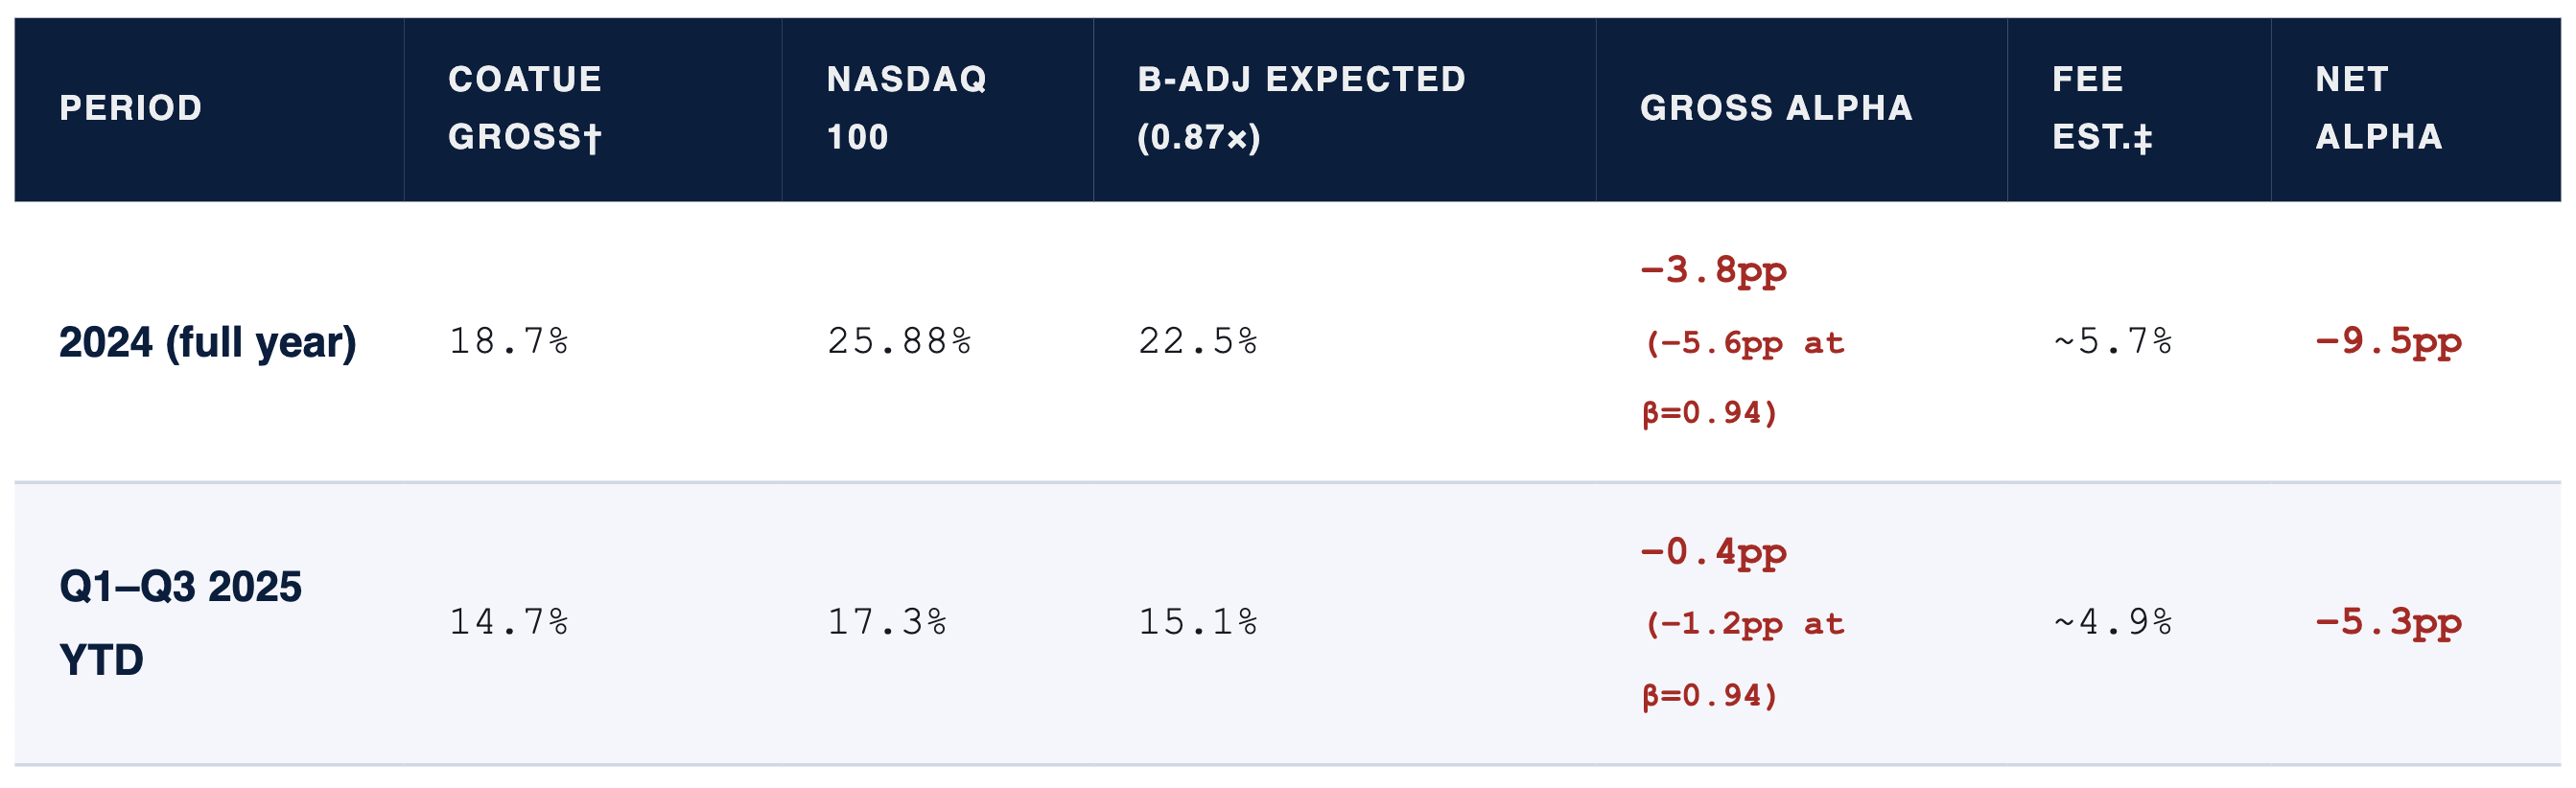
‡ Source: Institutional Investor Rich List for 2024; Crain Currency/P&I for both 2025 YTD figures. Coatue returns are Institutional Investor’s attribution, not audited results from Coatue.
§ Source: Invesco QQQ Quarterly Outlook.
† Model estimate: 2% management fee + 20% × gross return under standard 2-and-20 structure. Actual fees vary: funds with a high-water mark above current NAV pay no performance fee in years where NAV remains below that mark. In a recovery year following a drawdown, the effective fee load can be significantly lower than this model shows. The model reflects the steady-state fee drag, not a post-drawdown scenario.
In 2024, Coatue’s gross return was 3.8pp below its own beta expectation at the 0.87× floor — 5.6pp below if the compressed vol ratio is closer to the true regime figure. After the estimated fee load, investors received roughly 13% while QQQ returned 25.88%. Coatue placed fourth among the industry’s highest earners in 2024. The managers ranked below it, charging comparable fees on comparable beta, produce worse relative outcomes by construction.
The complete Nasdaq beta derivation (with sensitivity analysis at both the 0.87 and 0.94 endpoints), the full Coatue fee decomposition table, and the three-band diagnostic for evaluating any TMT allocation are in the Patreon research note. The note covers the mechanism from first principles, including the capacity bound analysis and the one-calculation test for whether your specific fund has already crossed the threshold at which 2-and-20 is indefensible.
The Decay Curve: From 7.1pp to Negative
Pensions & Investments (February 24, 2020; subscription required, figures confirmed via search index) reported PivotalPath data showing the TMT index generated annualized alpha of 7.1 percentage points relative to the S&P 500 over the 10 years through December 31, 2019 — when PivotalPath tracked approximately $45 billion in TMT hedge fund assets across 85 managers. Caplis noted that capacity constraints mean “large institutional investors tend not to invest. They generally just can’t put enough money to work to move the needle.”
Coatue’s $59 billion in discretionary AUM — from its Form ADV filed March 2024 — is approximately 31% larger than the entire 2020 TMT universe PivotalPath tracked. The category alpha has declined from 7.1pp (10-year annualized through 2019) to 4.2pp (18-month trailing, per Institutional Investor, May 2026), against a historical median of 5.2pp.
Methodological note on the comparison: the 7.1pp is a 10-year annualized average and the 4.2pp is an 18-month trailing reading — structurally different windows. The like-for-like comparison is against the 5.2pp historical median, against which the current 4.2pp represents a 1.0pp shortfall. The full decline from 7.1pp to 4.2pp encompasses both the AI concentration event and the base-rate difference between a long-run peak and a current-period trailing measure.
The AUM decomposition — what is documented and what is inferred. The critical structural claim of this article is that the 4.2pp category average is distributed unevenly across fund sizes: large-AUM funds generate negative gross alpha while the category average is held up by smaller, more nimble managers. The industry-level evidence for this claim is documented: PivotalPath data reported by Business Insider (December 28, 2025) shows funds managing less than $500 million outperformed larger peers through November 2025, with sub-$100M funds returning 14.6%. Caplis is explicit on mechanism: “Their size gives them greater flexibility about the stocks they wager on and in what size.” The same report notes that in 2024, the dynamic was reversed — large funds led. The TMT-specific AUM-band decomposition of the 4.2pp figure is not publicly available from PivotalPath’s published data; the claim that large-AUM TMT funds are dragging below the category average is a structural inference from the position-sizing mechanics and the industry-wide AUM return patterns, not a directly documented decomposition. Readers who want to stress-test this specific claim should request PivotalPath’s AUM-band analysis for the TMT category directly.
Approximate capacity bound (analytical inference, not directly cited from any source): position-sizing mechanics imply mid-cap idiosyncratic alpha is accessible at fund sizes below approximately $2–3B, where a 2.5% position weight represents $50–75M and is viable in companies with $1–5B market caps. PivotalPath’s March 2024 data showed mid-sized managers ($1–2.5B) outperforming other AUM bands across all strategies in the TMT-heavy February 2024 period — one data point, covering all strategies, not a systematic TMT study.
The Strongest Counterargument
PivotalPath’s own data shows 4.2pp annualized gross alpha over the 18 months through April 2026. Caplis is explicit: “technology funds are generating alpha, or returns above what the market itself would deliver.”
Three responses. First, the alpha is declining on a trajectory consistent with capacity crowding: 7.1pp (10-year avg through 2019) → 5.2pp (historical median) → 4.2pp (current), with the force driving that decline still operating. Second, at 2-and-20 with 4.2pp gross alpha, the performance fee consumes 0.84pp and the management fee 2.0pp — net alpha to investor ≈ 1.4pp, insufficient to compensate for lockup, drawdown asymmetry, and the tail risk Caplis himself named: “If the S&P is off 20 percent, these guys are going to be down huge.” Third, as the AUM decomposition section above acknowledges, the precise allocation of the 4.2pp across AUM tiers is not publicly documented at the TMT-category level. What is documented is that at the $59B scale, Coatue’s gross alpha was negative against beta expectations in both examined periods.
What Would Reverse This
Breadth recovery: if the equal-weight S&P 500 begins systematically closing the gap with the cap-weighted index, the mega-cap positioning constraint on large TMT long books relaxes. This gap is currently at a multi-decade extreme: the three-year cap-weight outperformance over equal-weight is the widest since 1971, per Motley Fool citing S&P data, corroborated by RBC Wealth Management’s January 2026 analysis (32% three-year gap, exceeding the 31% peak of the late 1990s). On a trailing 12-month basis, equal-weight lagged by 9% through April 2026, per S&P Dow Jones Indices.
Factor regime shift: a sustained period in which value spreads, quality-over-growth, or macro factors dominate returns would displace the AI beta mechanism. PivotalPath identifies managed futures, global macro, and systematic equity quant as the strategies that currently maintain meaningful diversification and that underperformed most in 2025’s equity rally before recovering.
The thesis is falsifiable: it would be disproven if PivotalPath’s TMT beta to the S&P 500 returned durably below 0.6 and category-average gross alpha recovered above 6pp. Neither condition obtains while Mag-7 names account for a dominant share of equity index returns and TMT fund AUM stays concentrated in the funds forced to hold those same names.
The one-calculation diagnostic, its three-band threshold framework (above 5pp / 2–5pp / below 2pp), and the full capacity bound analysis are in the Patreon research note.
The Actionable Implication and Its Capacity Bound
For TMT or AI-focused hedge fund allocations at funds above approximately $10 billion: the correct revaluation question is not “what alpha can this manager generate in theory” but “what is the net-of-fee cost of the beta being delivered?” At 0.87× Nasdaq beta (conservative floor) and approximately 5–6% annual estimated fee drag in a positive return year, a 70/30 QQQ/short-duration Treasury allocation delivers comparable factor exposure at 18 basis points. The ~1.4pp net alpha residual in the category average does not compensate for lockup and the asymmetric downside.
For allocators who can write $50–150M checks into sub-$2B TMT managers: the residual alpha is real where the position-sizing constraint does not bind, and PivotalPath data confirms that smaller funds maintained higher returns through 2025. The caveat is structural access — Caplis identified in 2020 that “large institutional investors tend not to invest” in this segment because minimum ticket sizes relative to fund capacity make meaningful allocation impossible.
The diagnostic test for any existing TMT allocation: compute (fund’s 18-month gross return) − (0.87 × R_Nasdaq over the same period). If the difference is below 5pp annualized, the manager has passed the capacity threshold at which 2-and-20 is defensible. Below 2pp, the structure is extracting more value than it creates. The 4.2pp category average is in the amber zone, declining, and likely weighted upward by smaller managers that most large allocators cannot access at scale.
📊 Want Deeper Quantitative Analysis?
This research took a very long time of data collection, verification, and analysis. If you found value in this deep-dive, I publish exclusive quantitative research, trading strategies, and institutional-grade analysis on Patreon.
By joining, you’ll be supporting my work and motivating me to publish more content like this.
→ Join the Patreon community here
Connect with The Mathematical Trader:
📺 Subscribe on YouTube — video breakdowns of quantitative finance and institutional strategies
💼 Follow on LinkedIn — research updates and institutional finance commentary
Primary sources, all fetched and verified: PivotalPath via Institutional Investor, May 27, 2026 · PivotalPath via Axios, October 30, 2025 · PivotalPath 10-Year Press Release, November 2023 · Nasdaq Global Indexes — NDX vs. SPX Q4 2025 · Invesco QQQ Quarterly Outlook · Institutional Investor 24th Annual Rich List · Crain Currency/P&I, October 15, 2025 · Pensions & Investments, February 24, 2020 (subscription) · Business Insider / PivotalPath small-fund data, December 28, 2025 · Brunnermeier & Nagel, Princeton, 2004 · PivotalPath PPOV March 2024 · Reuters/Hedgeweek on Goldman AI tech hardware, October 2025 · Coatue Form ADV via SEC IAPD · Motley Fool — S&P 500 equal-weight gap, January 2026 · RBC Wealth Management — The Great Narrowing, January 2026 · S&P Dow Jones Indices Equal Weight Sector Dashboard, April 2026
Cover photograph: Nielsoncaetanosalmeron, CC BY 4.0, via Wikimedia Commons.