


Every crisis is blamed on bad actors, poor regulation, or systemic greed. But beneath the headlines lies something more fundamental: the mechanical infrastructure that determines how markets execute, how risk is calculated, and how liquidity flows. These aren’t policy choices. They’re hardcoded rules in exchange matching algorithms, bankruptcy law, shadow banking priority structures, and risk models.
Four specific mechanisms make crashes inevitable: algorithms that create phantom liquidity at the execution layer, legal doctrines that make trillions bankruptcy-remote at the asset layer, priority structures that determine who gets paid when banks fail, and risk models that guarantee leverage peaks when markets are most fragile. Each mechanism alone creates vulnerability. Together, they form a system that makes crises mathematical certainties.
I. CME Matching Algorithms: How FIFO and Pro-Rata Create Phantom Liquidity
Price discovery isn’t purely about supply and demand. The specific matching algorithm running on CME Globex determines which orders get filled and creates distinct market microstructures with very different liquidity characteristics.
S&P 500 futures (ES) use FIFO (First-In-First-Out): strict time priority. The first order at a price level gets filled first. This creates a latency arms race. High-frequency traders invest millions in co-location and nanosecond execution to hold queue position. When volatility spikes, this “liquidity” vanishes instantly. The liquidity wasn’t real depth, it was algorithmic positioning that disappears when the queue resets.
SOFR futures use Pro-Rata allocation: priority by size. If you bid 10,000 contracts and I bid 10 at the same price, you receive ~99.9% of the fill. This incentivizes quote stuffing where algorithms post massive orders to capture tiny fills, creating the illusion of deep markets. The displayed liquidity is hollow.
The May 2015 Treasury futures glitch proved this matters. When 2-Year Treasury futures accidentally switched from a hybrid “K algorithm” (40% FIFO, 60% Pro-Rata) to pure FIFO for two days (May 11-12), researchers documented that “orders placed later in time are significantly more profitable under pro-rata” while “prices to be less efficient under pro-rata rules.” The matching algorithm fundamentally alters market structure.
But phantom liquidity at the execution layer is only the first mechanism. The second operates at the asset layer itself.
II. The True Sale Doctrine: How $13 Trillion Becomes Bankruptcy-Remote
Banks don’t just sell mortgages to create CDOs. They must legally teleport them through a “True Sale” to a Special Purpose Vehicle.
External counsel must certify the transfer is a sale, not a secured loan. If it’s a True Sale, the assets become “bankruptcy remote”. When Lehman Brothers collapsed, assets in properly structured SPVs could not be touched by Lehman’s creditors. The legal opinion creates a forcefield around over $13 trillion in U.S. securitized assets ($11+ trillion in agency MBS plus $2+ trillion in non-agency RMBS, CMBS, and ABS).
Without this clause, the entire shadow banking system collapses. The doctrine distinguishes “assignments to secure loans from true sales, after which assets are the property of a special-purpose entity.” This isn’t about economics, it’s about which legal entity has standing to seize assets in bankruptcy court.
Bankruptcy remoteness protects certain assets. But there’s a third mechanism that determines the hierarchy of who gets paid when institutions fail.
III. FHLB Super Lien Priority: How Shadow Liquidity Cost FDIC $13 Billion in the SVB Failure
The Federal Reserve isn’t the only lender of last resort. The Federal Home Loan Banks provide advances (collateralized loans) to member banks, and they have statutory priority over the FDIC.
When Silicon Valley Bank failed, it owed the FHLB of San Francisco $30 billion in advances. The FHLB got paid first, before depositors, before the FDIC. This super lien meant “the cost of resolution is $13 billion more to the FDIC” according to Karen Petrou at Federal Financial Analytics, because the FHLB seized higher-quality collateral first.
The FHLB has never posted a loss on advances because of overcollateralization and this priority position. This creates moral hazard: zombie banks can borrow from FHLB to stay alive, maximizing eventual failure costs while the shadow lender walks away whole. The FHLB advanced $675.6 billion in one week during March 2023 bank stress, functioning as the true liquidity backstop.
These three mechanisms—phantom liquidity, bankruptcy remoteness, and super-priority claims—create fragility in market structure, asset ownership, and funding hierarchies. But the fourth mechanism determines when the system actually breaks: how risk itself is measured.
IV. The VaR Paradox: Why Low Volatility Predicts Banking Crises
Every risk manager on Wall Street uses Value-at-Risk to set position limits. The standard method: Historical Simulation.
The defect is fundamental. Historical Simulation assumes stationarity: the future distribution of returns will resemble the past. If the last 500 days were calm (low volatility), VaR calculates that risk has disappeared. This creates the volatility paradox: “prolonged periods of low volatility have strong predictive power over the incidence of banking crises” because “low volatility leads to excessive credit buildups and balance sheet leverage.”
Research from the New York Fed documents that banks maintain a roughly constant VaR-to-equity ratio. When measured risk drops, they lever up. This procyclicality means banks maximize leverage exactly when markets are most fragile. Adrian and Shin show that during calm periods before 2007, “unit VaR” (VaR per dollar of assets) fell dramatically, but banks kept their VaR/Equity constant by expanding balance sheets.
The model doesn’t measure risk. It manufactures it by authorizing maximum leverage at the worst possible time. As one study notes, VaR underestimates required capital by over 40% during low volatility, then overestimates by 30% during crises, forcing deleveraging when liquidity is scarcest.
The Four Rules That Make Crashes Inevitable
Financial crises aren’t caused by moral failures or regulatory gaps. They’re the inevitable output of four hardcoded mechanisms working in combination:
1. Matching algorithms create phantom liquidity that vanishes in stress (FIFO latency arms race, Pro-Rata quote stuffing)
2. Legal structures make $13 trillion in assets bankruptcy-proof, enabling shadow banking (True Sale doctrine)
3. Priority hierarchies ensure shadow lenders get paid first, maximizing failure costs (FHLB super liens cost FDIC $13B in SVB)
4. Risk models authorize maximum leverage during calm periods (VaR stationarity creates the volatility paradox)
Each mechanism alone creates fragility. Together, they form a system where:
Markets display deep liquidity that’s algorithmically hollow
Trillions in assets are legally unreachable in bankruptcy
Failed banks pay shadow creditors before depositors
Risk models guarantee leverage peaks exactly when markets are most vulnerable
Crises aren’t aberrations. They’re what happens when phantom liquidity evaporates, bankruptcy-remote assets can’t be seized to cover losses, super-priority claims drain remaining value, and procyclical risk models force deleveraging simultaneously. The crashes are mechanical outputs of the infrastructure itself.
You can’t regulate away financial crises when the crisis mechanisms are built into the architecture of price discovery, asset ownership, funding hierarchies, and risk measurement. These four rules make the next crash not a question of if, but when.
📊 Want Deeper Quantitative Analysis?
This research took very long time of data collection, verification, and analysis. If you found value in this deep-dive, I publish exclusive quantitative research, trading strategies, and institutional-grade analysis on Patreon.
By joining, you’ll be supporting my work and motivating me to publish more content like this.
→ Join the Patreon community here
Connect with me:
LinkedIn for discussions on quantitative research and systematic trading
YouTube for technical breakdowns of hedge fund strategies and market mechanics
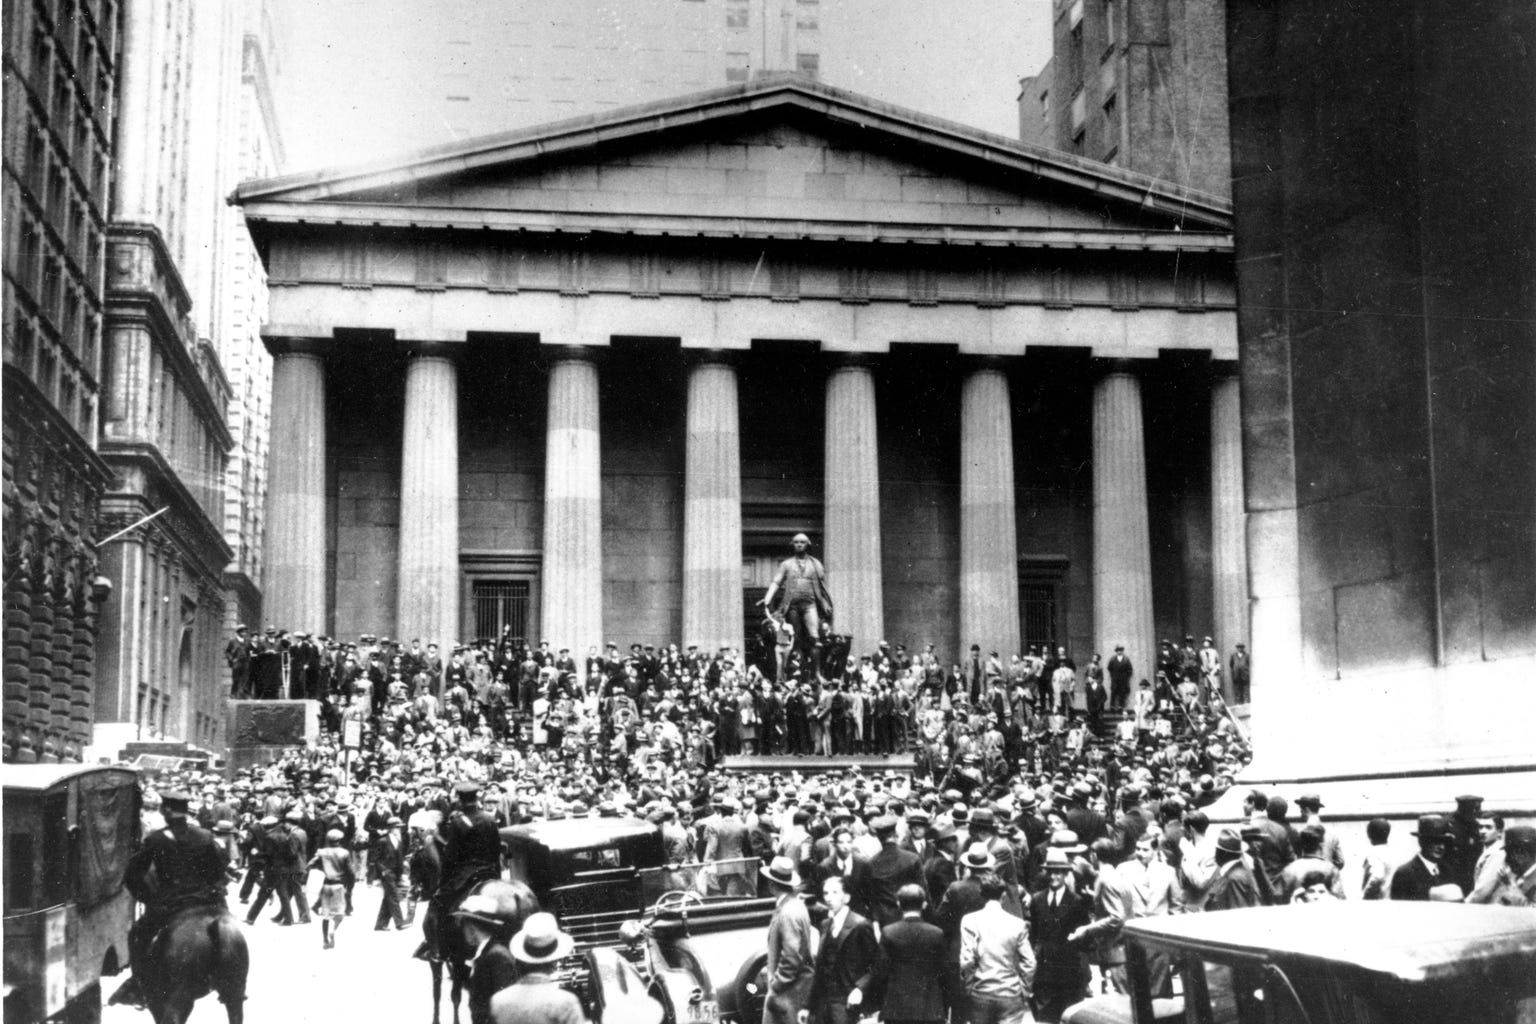
Cover photograph: Associated Press, public domain, via Wikimedia Commons.
The SVB forensics here are particularly damning. The fact that FHLB priority structurally costs FDIC more during failures is something most people miss when talking abut bank runs. I worked near this space for a while and the VaR stationarity problem is real, watching risk limits loosen during calm periods always felt backwards. The CME FIFO vs Pro-Rata breakdown is usefull context too.